8 Housing in the PlanRVA Region
Richmond Magazine’s “It Takes More Than A Village” article recently highlighted the challenges the Richmond regional housing market continues to face. Housing costs - both for rental and homeownership - are up significantly from where they were over a decade ago and the abundant supply has dwindled to a trickle.
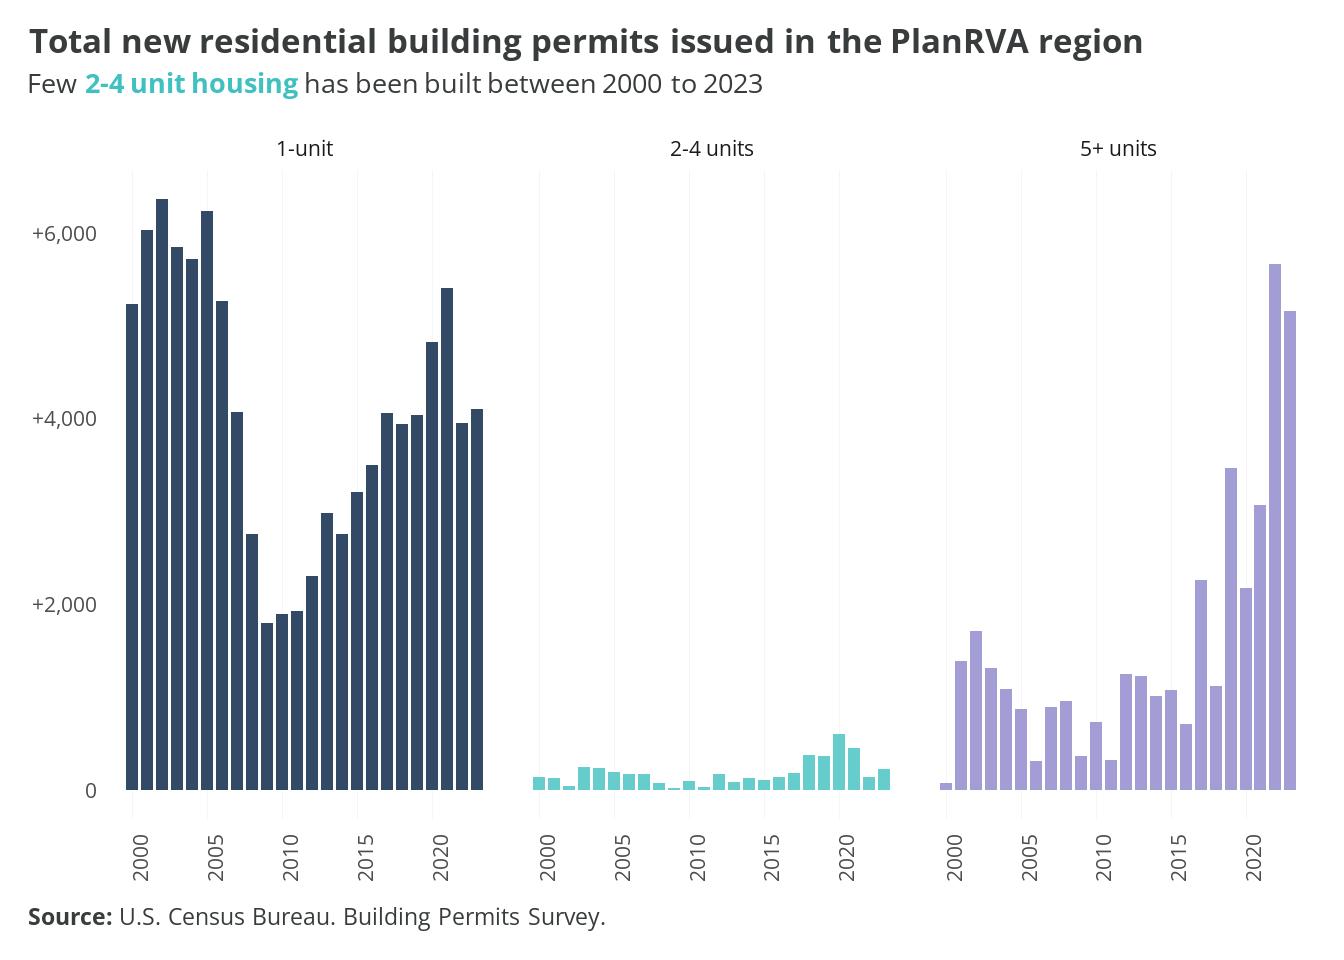
The Census Building Permit Survey from 2000 to 2022 shows that single-family construction starts have been on the way to recovery since the Great Recession.1 But they still pale in comparison to pre-Recession numbers. The market shift to multifamily in the past few years speaks to not only growing preferences among households, but also the challenges residents face in accessing the homeownership market (e.g., interest rates, increasing debt, competition with cash buyers, etc.).
The region, not unlike others in the Commonwealth, is very much lacking in the construction of smaller two to four unit buildings, so often seen in the historic neighborhoods of Richmond. This “Missing Middle” is literally missing in the market.

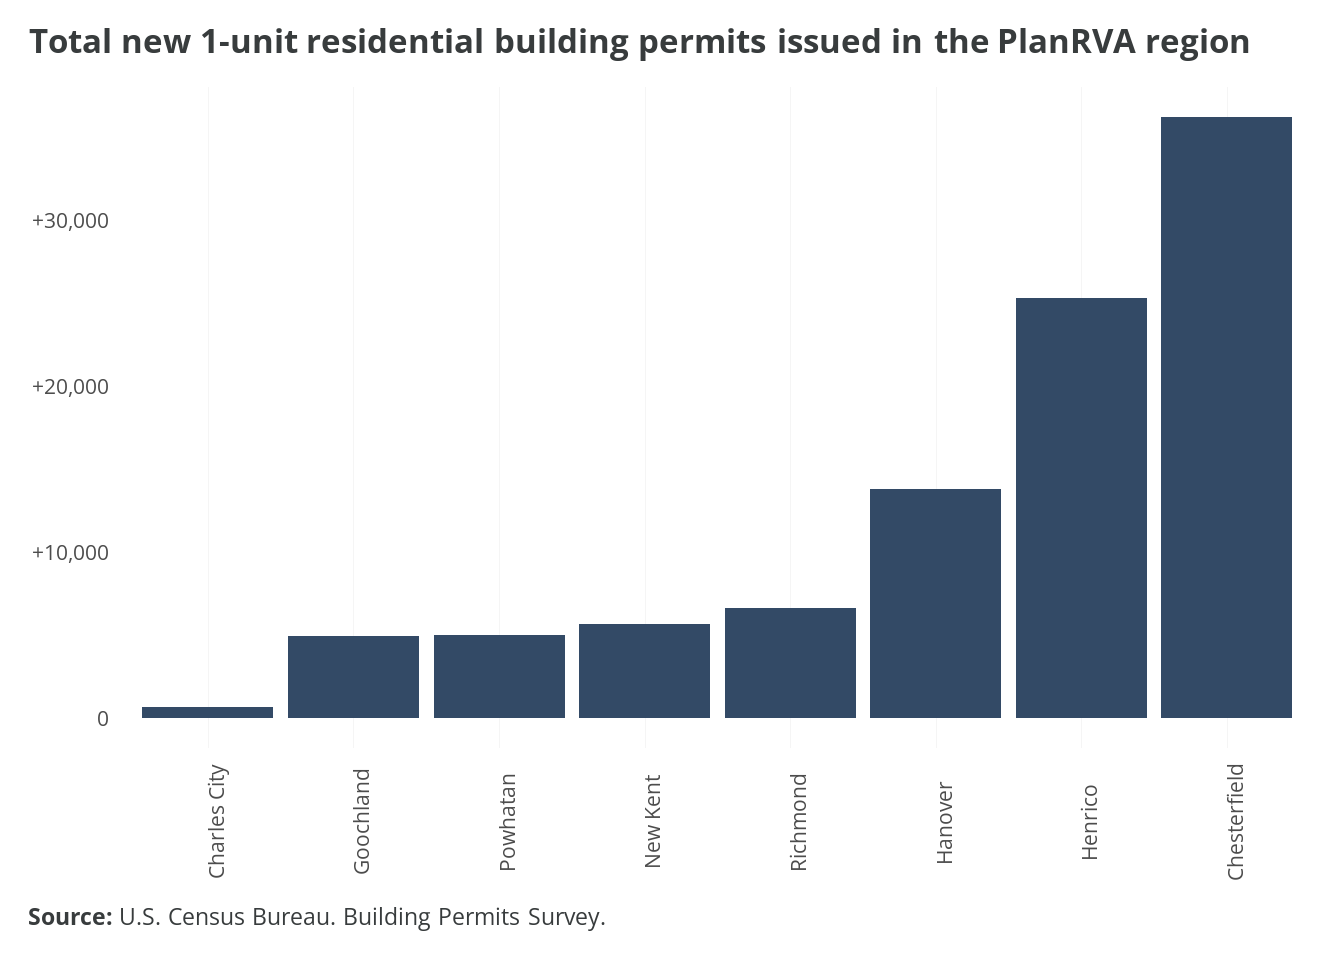
Single-family construction starts (which includes single-family attached housing) are high in the largest counties in the region, where greenfield development opportunities are numerous. Infill development opportunities in the City of Richmond limit the ability for substantial new supply of homeownership, but opportunities still exist for resale and redevelopment.

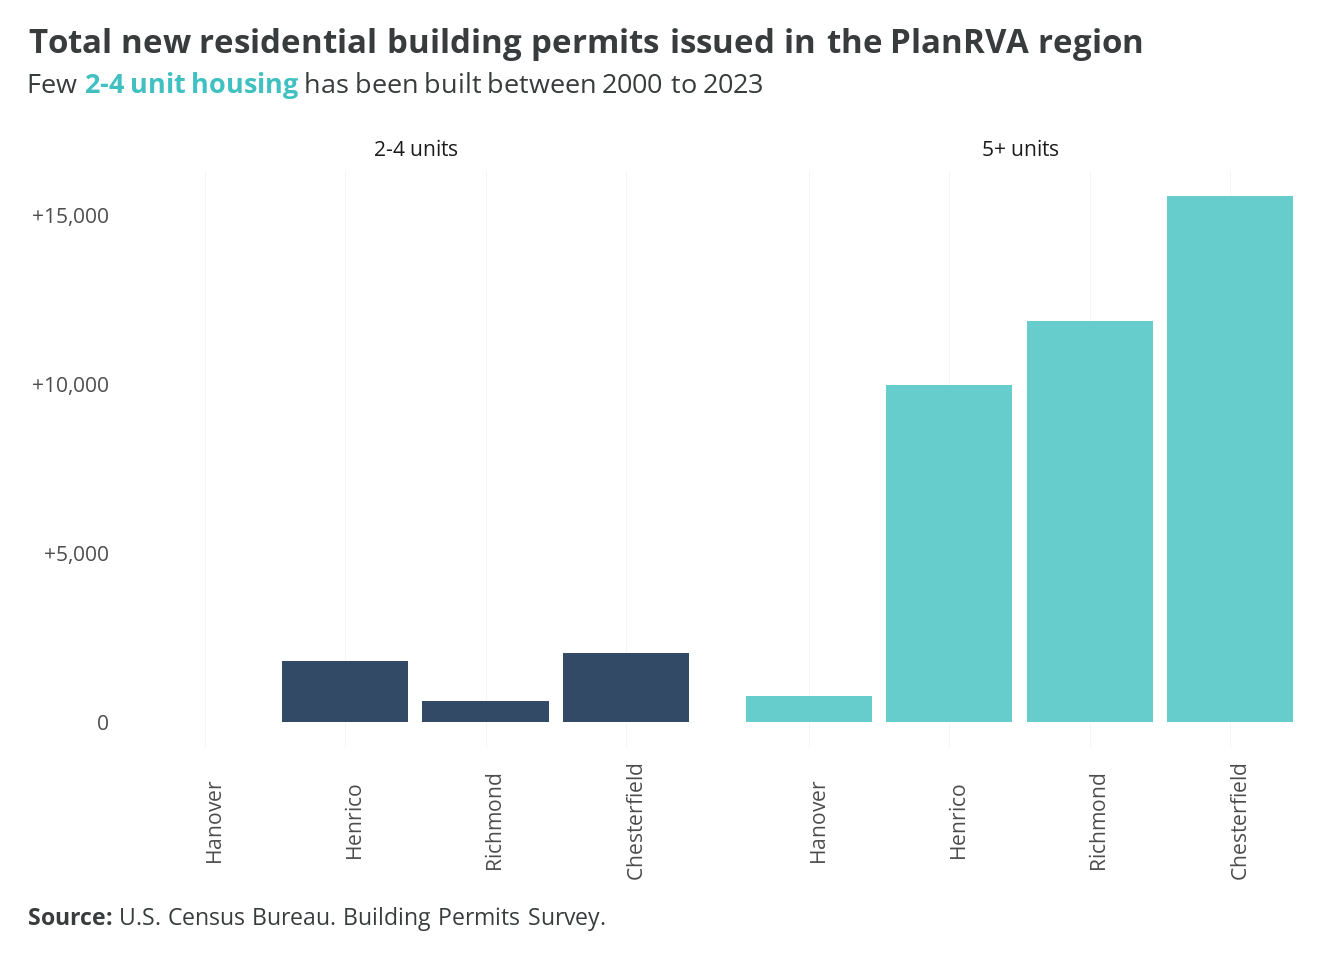
Observing variations across jurisdictions, it may surprise many that Chesterfield County exceeds the City of Richmond in 2-4 unit and 5 or more unit construction starts. Henrico County also exceeds Richmond in terms of the number of 2-4 unit residential buildings. As noted previously in a footnote, building permit data from the Census Bureau should be taken with caution. But generally, the region continues to underbuild in the face of a rising population. The University of Virginia’s Weldon Cooper Center noted that between 2020 and 2023, the Richmond region saw the greatest increase in new residents (+40,000). The relative affordability of the region compared to other major metros along the Mid-Atlantic and the continued proliferation of remote work opportunities has continued to bring residents — often with higher incomes — to the region.

The demand from new residents and the undersupply of housing has contributed to significant price increases in recent years. The median home sales price in the Richmond Metropolitan Area has reached $400,000 as of the second quarter of 2024. This is a far cry from 2014 when the median price was under $200,000. And while it is important to note that the value of the dollar has changed over time, everyday people interpret home prices based on their experience at the time. For that reason, we present the median home sales price in nominal dollars (i.e. what the price was at that time) and real dollars (i.e., what the price is in current dollars).
The days on market for homes has decreased across the Commonwealth as buyers compete for the little supply that exists out there. The median days on market has remained below 30 days along the I-95/I-64 corridor. In the Richmond region, the median days on market has barely risen above 10 days since the onset of the pandemic and is on par with the competition and demand seen in the DC Metro Area.
With home prices continuing to rise in the region, it is no surprise that the share of renters has increased. Those increases from 2010 to 2022 were most prevalent in Henrico and Goochland. But overall, every locality other than Powhatan and New Kent have seen an increase in their share of renters. The demand for rental continues to rise in the region as homeownership becomes more and more out-of-reach even for middle-income households.
Rents saw major nominal jumps in 2021. Increased rental demand amid COVID protections led to less unit turnover and even less available supply, leading to subsequent rent increases. Recent data from CoStar Group, Inc. estimates that the average asking rent in the region is just over $1,400. For a household to not be rent cost-burdened, they would have to make approximately $56,000 annually. This figure is about $18,000 more than the median renter household income in the Richmond Metropolitan Statistical Area - $48,171 in 2022. Based on these estimates, more than half of renters in the entire metro area could not afford rent in the Richmond region.
A healthy rental vacancy rate is dependent on various factors, including location and economic conditions. Generally, a rate between 5 and 10 percent is considered balanced between supply and demand. Before the pandemic, the rental vacancy rate in the region sat between 6 and 8 percent. During the pandemic, that rate dropped below 5 percent, before climbing to a record 9 percent in the last quarter of 2023. According to the Virginia REALTORS, “the rise in vacancy rates is attributed to the apartment construction boom of 2022 as builders attempted to meet the need for more housing.”
While this may indicate an oversupply, lease up will continue to occur as new inventory hits the market and vacancy rates will trend down in the coming quarters. Rent growth may slow as more units are continuously added to the region, but one fact remains, the income for many renters is not keeping pace.
8.1 Conclusions
The Richmond region’s for-sale market has continued to see major increases in sales prices, while rents follow albeit at a slower pace. But the fact remains that more diverse types of housing are needed in both the for-sale and rental markets. Zoning can act as an artificial limiter on the housing supply and as we will see in the next section, there are dozens of opportunities to increase supply in all parts of the region.
Adam Pagnucco, a writer on state and local politics, has written about the potential pitfalls of Census Building Permit Survey in accurately accounting for building starts in his piece This Mess Must Be Fixed. To that end, it must be noted that BPS relies on localities to voluntarily submit accurate data to the Census Bureau. Estimates shown may not be completely accurate depending on the locality and their participation in the survey. In lieu of data directly from the locality, BPS often serves as the sole source of this information.↩︎