7 Northern Virginia’s Land Use Restrictions in Context
The following section describes Northern Virginia’s housing market under these land use rules and compares Northern Virginia to peer regions.
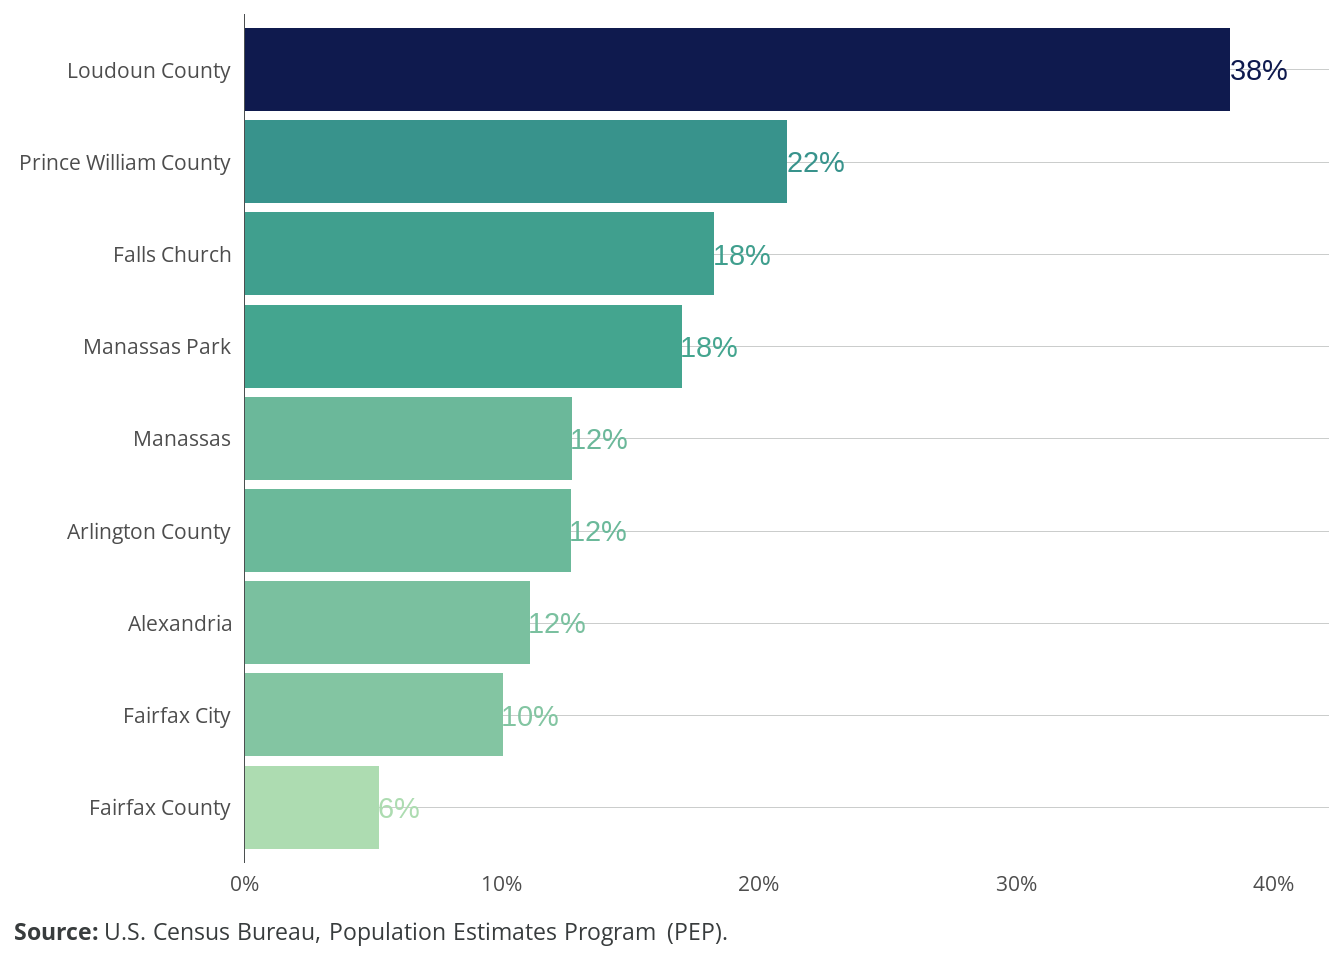
Although land use regulations across Northern Virginia limit housing construction and drive up its costs, the commonwealth’s population is growing faster than the United States’ as a whole. Relative to some high-demand parts of the country, Virginia’s regulatory burden is lighter. The slowestgrowing jurisdiction (Fairfax County) grew 5.23 percent from 2010 to 2022, the median jurisdiction (Manassas) grew 12.75 percent, and the fastest-growing jurisdiction (Loudoun County) grew 38.35 percent (Figure 7.1). As a point of comparison, California grew only 4.6 percent over this time and has lost population in the most recent years.

In spite of Northern Virginia’s relative accommodation of population growth, house prices have increased as well (Figure 7.2). Between 2019 and 2023, the greater Washington, DC, area saw an increase of roughly 13 percent after adjusting for inflation. Out of nine jurisdictions, only two, Arlington County and Falls Church, saw a decline in the median sale price during this period.
Since 2010, average rents in Northern Virginia have climbed almost $200 a month after adjusting for inflation (Figure 7.3); the vacancy rate has been consistently lower than the national rate, with an exception for the depths of the pandemic (Figure 7.4).
Across the country, local governments use similar types of rules to restrict housing construction, but the extent of these restrictions varies widely. The substantial affordability challenges caused by land use regulations in Northern Virginia and the DC metropolitan area notwithstanding, this region is more open to housing construction than many other metropolitan coastal regions are. For example, during the construction of rail transit in Arlington, the county upzoned nearby areas, allowing for more multifamily construction.1 Fairfax County adopted a transit-oriented development plan in Tysons, allowing a large increase in multifamily construction. Loudoun County is the region’s fastest-growing municipality owing in large part to greenfield construction, but its growth includes substantial townhouse and multifamily construction along with detached single-family construction.
In contrast, the suburbs of other high-income coastal regions, such as San Francisco, Boston, Los Angeles, and New York City, have allowed much less multifamily construction. Some of Boston’s suburbs lie in New Hampshire, a state with a completed zoning atlas. Some 93 percent of New Hampshire’s developable land is restricted to exclusively detached single-family zoning, compared with 71 percent in Northern Virginia. In New Hampshire, single-family houses on lots less than one acre are allowed on only 15 percent of developable land, whereas 69 percent of Northern Virginia’s developable land allows for plausible single-family construction on less than an acre of land.
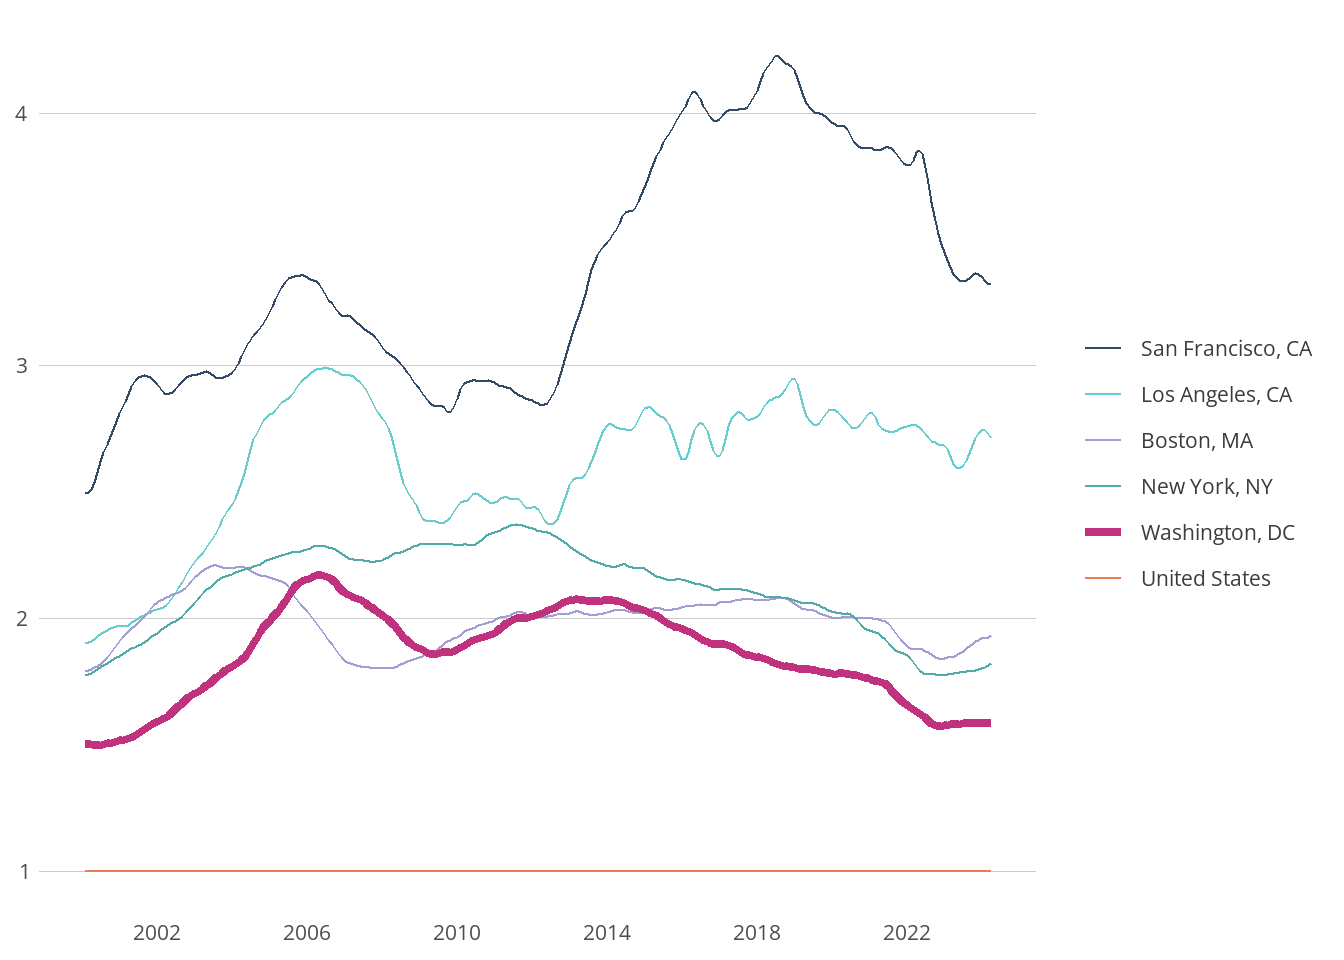
The price of housing in the Northern Virginia area is above the national average, but the DC metropolitan area is far less expensive than comparable regions that permit less housing construction (Figure 7.5). Since the turn of the millennium, while DC’s prices have been between 47 percent and 115 percent higher than national prices, Boston’s have been 77 percent to 118 percent higher; New York’s, 80 percent to 140 percent higher; Los Angeles’s, 85 percent to 192 percent higher; and San Francisco’s, 141 percent to 309 percent higher. As the atlas data show, policymakers in Northern Virginia have ample opportunities to reduce the barriers of local land use regulations. The problems caused by housing supply constraints, however, are far worse in more heavily regulated peer regions.

7.1 Conclusion
The NZA data provide an important new tool for advocates of zoning reform and open up new opportunities for researchers to study the effects of specific zoning rules and combinations of rules. We find that in spite of high demand to live in Northern Virginia, a majority of the land cannot be developed with more than one detached housing unit, and requirements for large lots are pervasive. Nonetheless, in many peer regions of the country, barriers to housing construction are higher, corresponding with more severe affordability problems. Northern Virginia already has a successful blueprint for reforming exclusionary zoning with examples such as Arlington’s transit corridors. The zoning atlas provides details on the rules facilitating construction across the region, pointing to reforms that could address the housing shortage in the large parts of the region where development is currently locked out.
7.2 Acknowledgments
In addition to the authors, Milica Manojlovic, Micah Perry, Rishab Sardana, and Arthur Wright gathered data for the Northern Virginia Zoning Atlas. Thank you to Eric Mai for sharing the code used to create these charts and maps and to him and Housing Forward Virginia for creating an interactive map of the Northern Virginia data available at https://housingforwardva.org/focused-initiatives/zoning/atlas/. Thank you to Yonah Freemark for sharing the data on zoning in the DC region that he collected for research at the Urban Institute. These data formed the basis of our geospatial data collection and served as a useful quality check on our zoning code analysis.
Emily Hamilton, “How DC Densified,” Works in Progress 11 (2023).↩︎