Appendix C — Naturally occurring affordable housing analysis
C.1 Homeownership: single-family and condo units
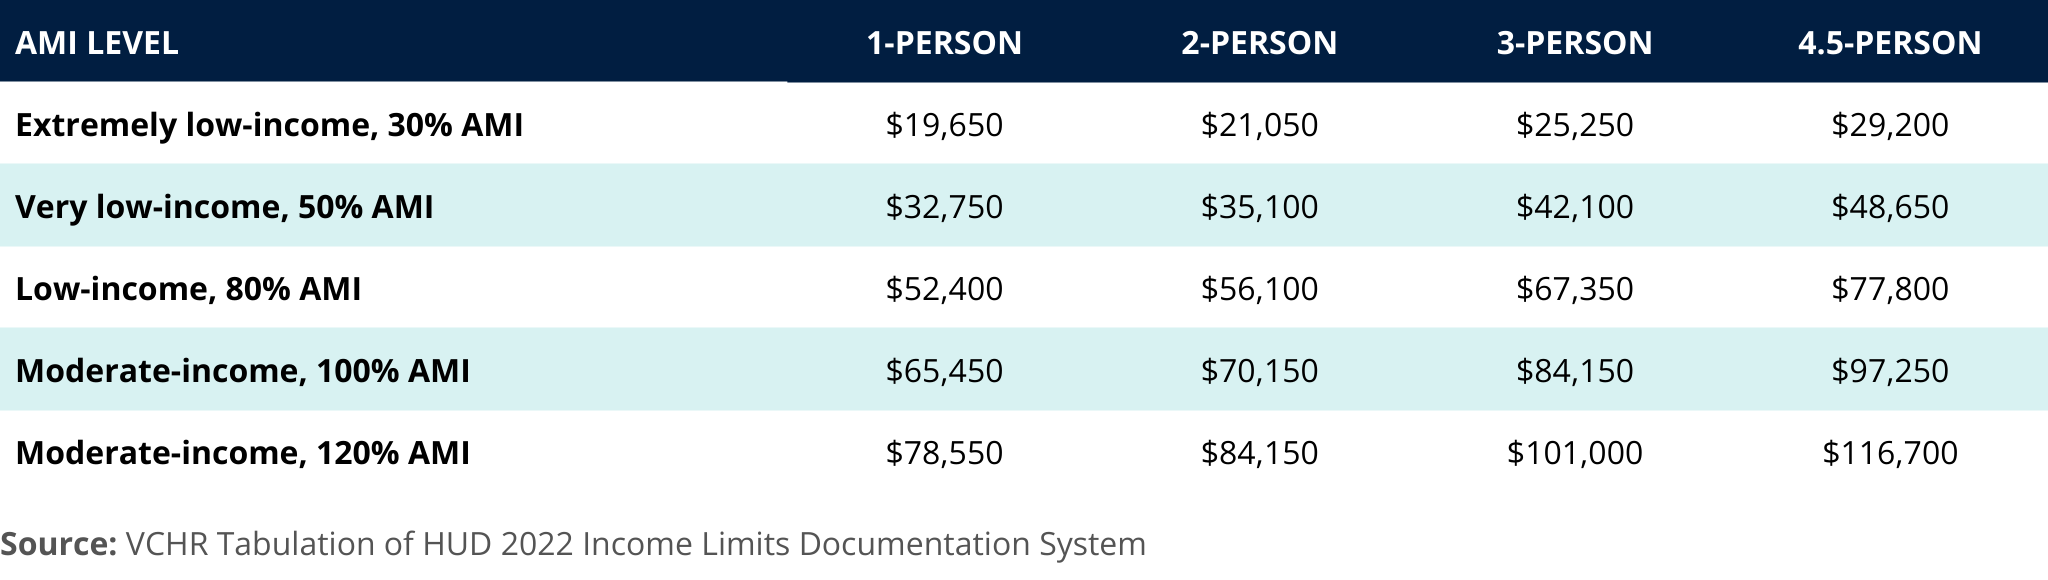
VCHR applied HUD FY 2022 Income Limits to assign an affordability level to each of 145,498 units included in the Virginia Beach Assessment Data. Table C.1 and Table C.7 provide the income limits and associated maximum affordable housing cost by number of bedrooms in the unit. These are the same limits applied in the HUD Consolidated Housing Affordability Strategy (CHAS) data to estimate the availability of units by income level. HUD uses multiples of the 1- and 4-person limits (1.5 and 4.5) to set affordable costs for 1-, 3- and 4-bedroom units based on occupancy assumptions. VCHR assigned affordability levels to units using both the 1.5-person limits and the 4.5-person limits. The 1.5-person limits are more likely to reflect the capacity of first-time homebuyers, while the 4.5-person limit may more readily correspond to more-established family income.
VCHR used the Virginia Beach MLS data to calculate the percent difference between the close price and tax assessed values for homes sold in 2022. The median percent difference for all units included in the recent MLS sales was then applied to the total taxable value of each home to adjust assessed value to an estimated value that homebuyers would be more likely to pay in the market. VCHR estimated a mortgage payment for each unit using two down-payment scenarios: 5% down and 10% down. To determine a monthly payment, analysts used the standard mortgage payment formula:
\[ M = P[i(1+i)^n/(((1+i)^n)-1)] \]
Here, M is the monthly payment, P is the principal amount (or the difference between the adjusted value and the down payment), i is the monthly interest rate, and n is the number of months (in this case, 360 for a 30-year mortgage). VCHR used the mortgage interest rate (0.0642%) for Freddie Mac’s 30-year fixed rate as of December 2022. It’s important to note that in recent years, the interest rate has increased significantly, so depending on the timing of the contract, the mortgage payment may have some volatility.
VCHR combined the mortgage payment with estimated monthly insurance payment, utility costs, real estate taxes, and HOA and condo fees to estimate the total monthly housing expenses. The average utility cost ($244.32) was calculated based on the 2021 Virginia Beach city PUMS data, encompassing monthly payments for fuel, water, electricity, and gas. Annual average insurance premiums in Virginia were applied from the 2020 National Association of Insurance Commissioners (NAIC) report. The annual real estate tax was calculated by applying Virginia Beach’s general tax rate of 0.99%. The HOA and condo fees were derived from 2022 MLS data, with the average fee for single-family detached and attached properties in Virginia Beach being $63.30, and the average condo properties being $272.20.
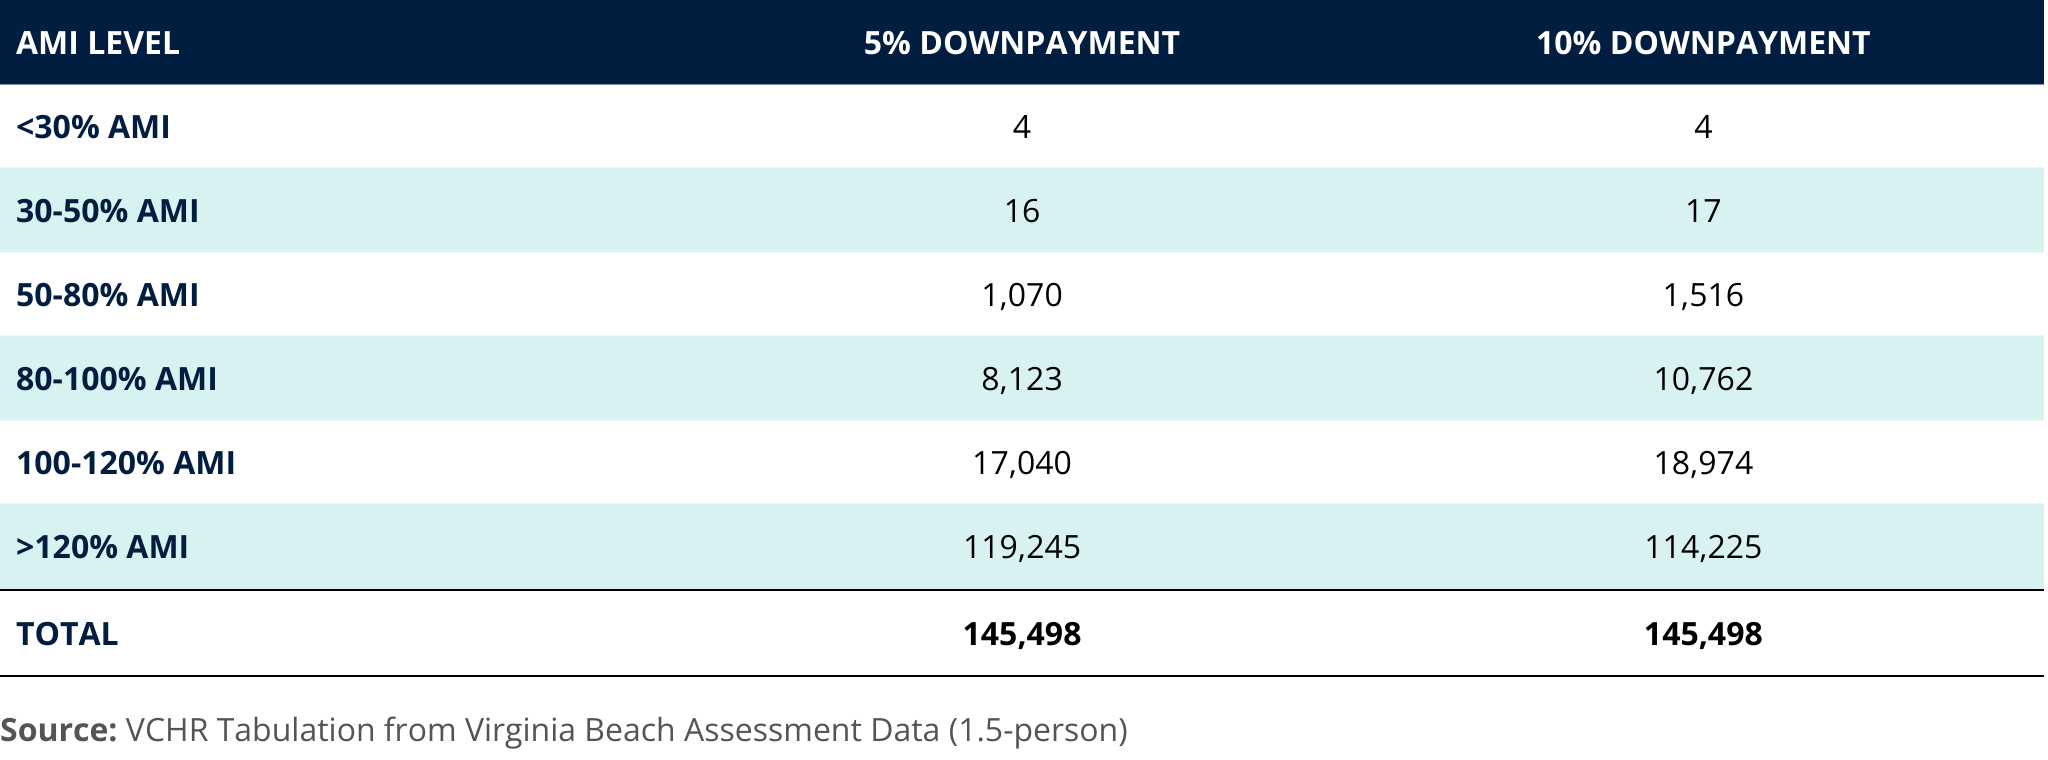
VCHR evaluated the affordability of 145,498 identified single-family detached, attached, and condo properties from assessment data based on down-payment percentages (5%/10%) and household sizes (1.5 person/4.5 person). These are presented in Table C.3 and Table C.4. For example, when a 5% down payment is made, approximately 8,123 properties are considered affordable for households with 1.5 persons and an income in the range of 80%-100%.
For 1.5-person households, approximately 9,213 units with a 5% down payment are affordable to households with incomes of $70,150 or less. For 4.5-person households, approximately 45,091 units with a 5% down payment are affordable to households with incomes of $97,250 or less. Though the units identified in this analysis may be affordable to low- and moderate-income households, they are not necessarily available to low- and moderate-income households. Many of those units are not reserved for low- and moderate-income households via income restrictions and are occupied by households with higher incomes.
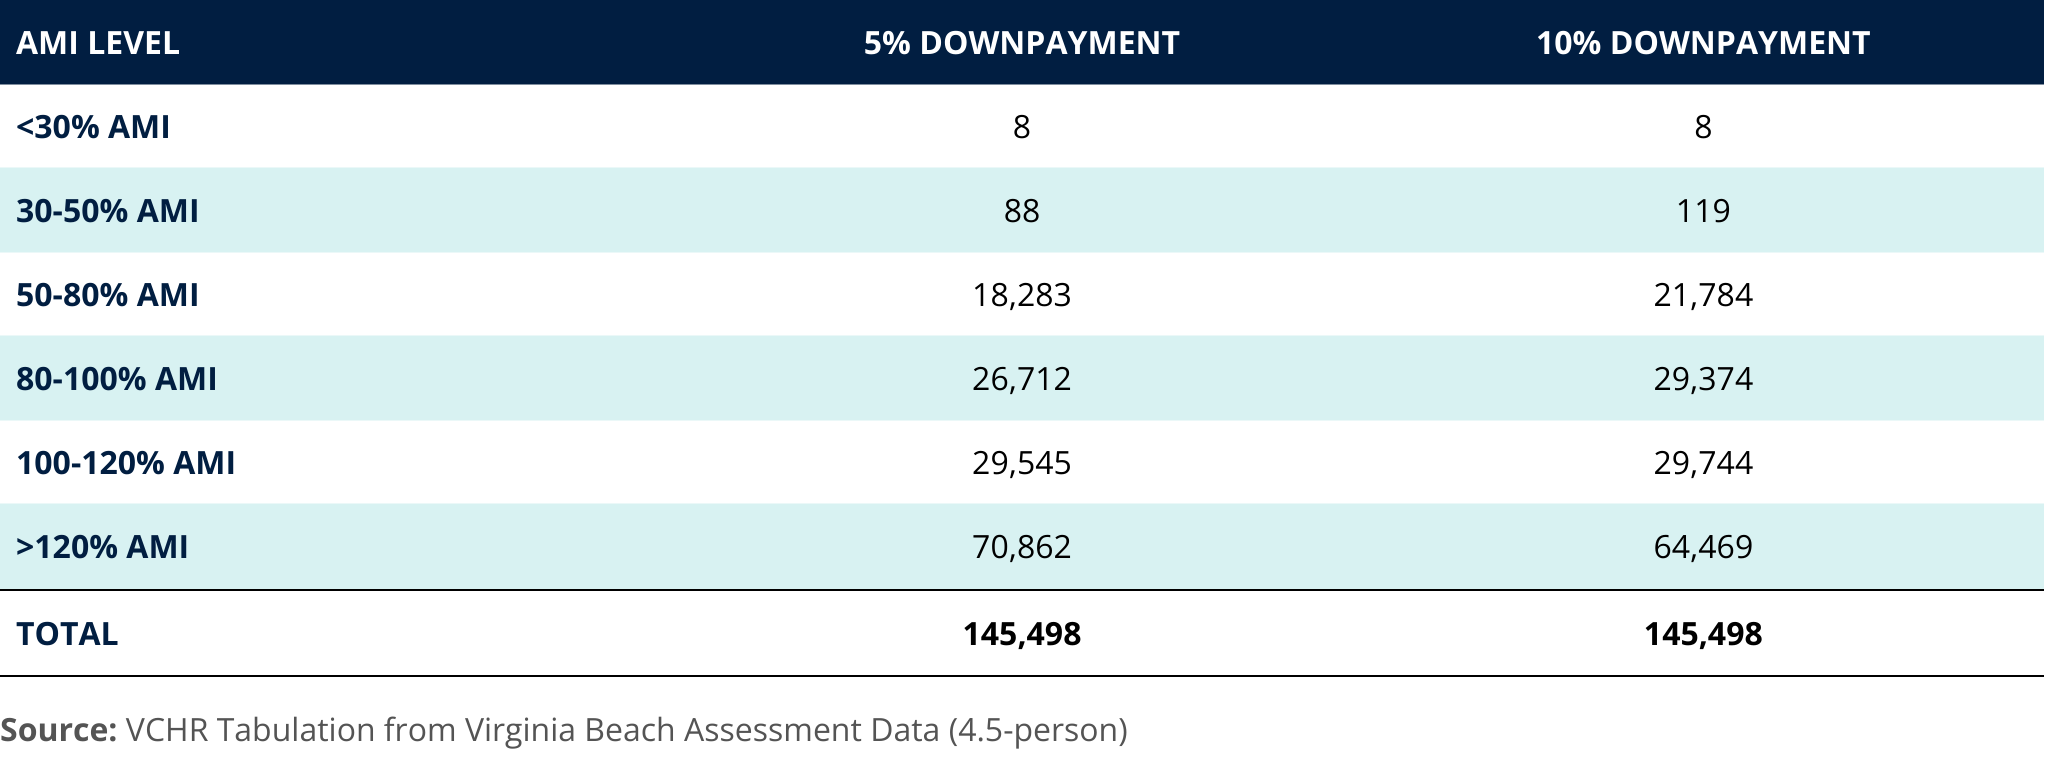
With 35% of homes in the overall housing market considered affordable options for ownership, when a 10% down payment is made, the scarcity of affordable housing options for households with moderate incomes or below (4.5-person households) is evident. Furthermore, according to VCHR's analysis, 98% of these units were constructed prior to the year 2000. This raises concerns about potential additional costs for renovations and maintenance due to age-related issues and overall condition. In the end, the majority of residents in Virginia Beach inevitably face cost-burden problems when it comes to homeownership. Affordable housing remains a scarce resource, making it difficult for many individuals and families to find suitable and affordable housing options.
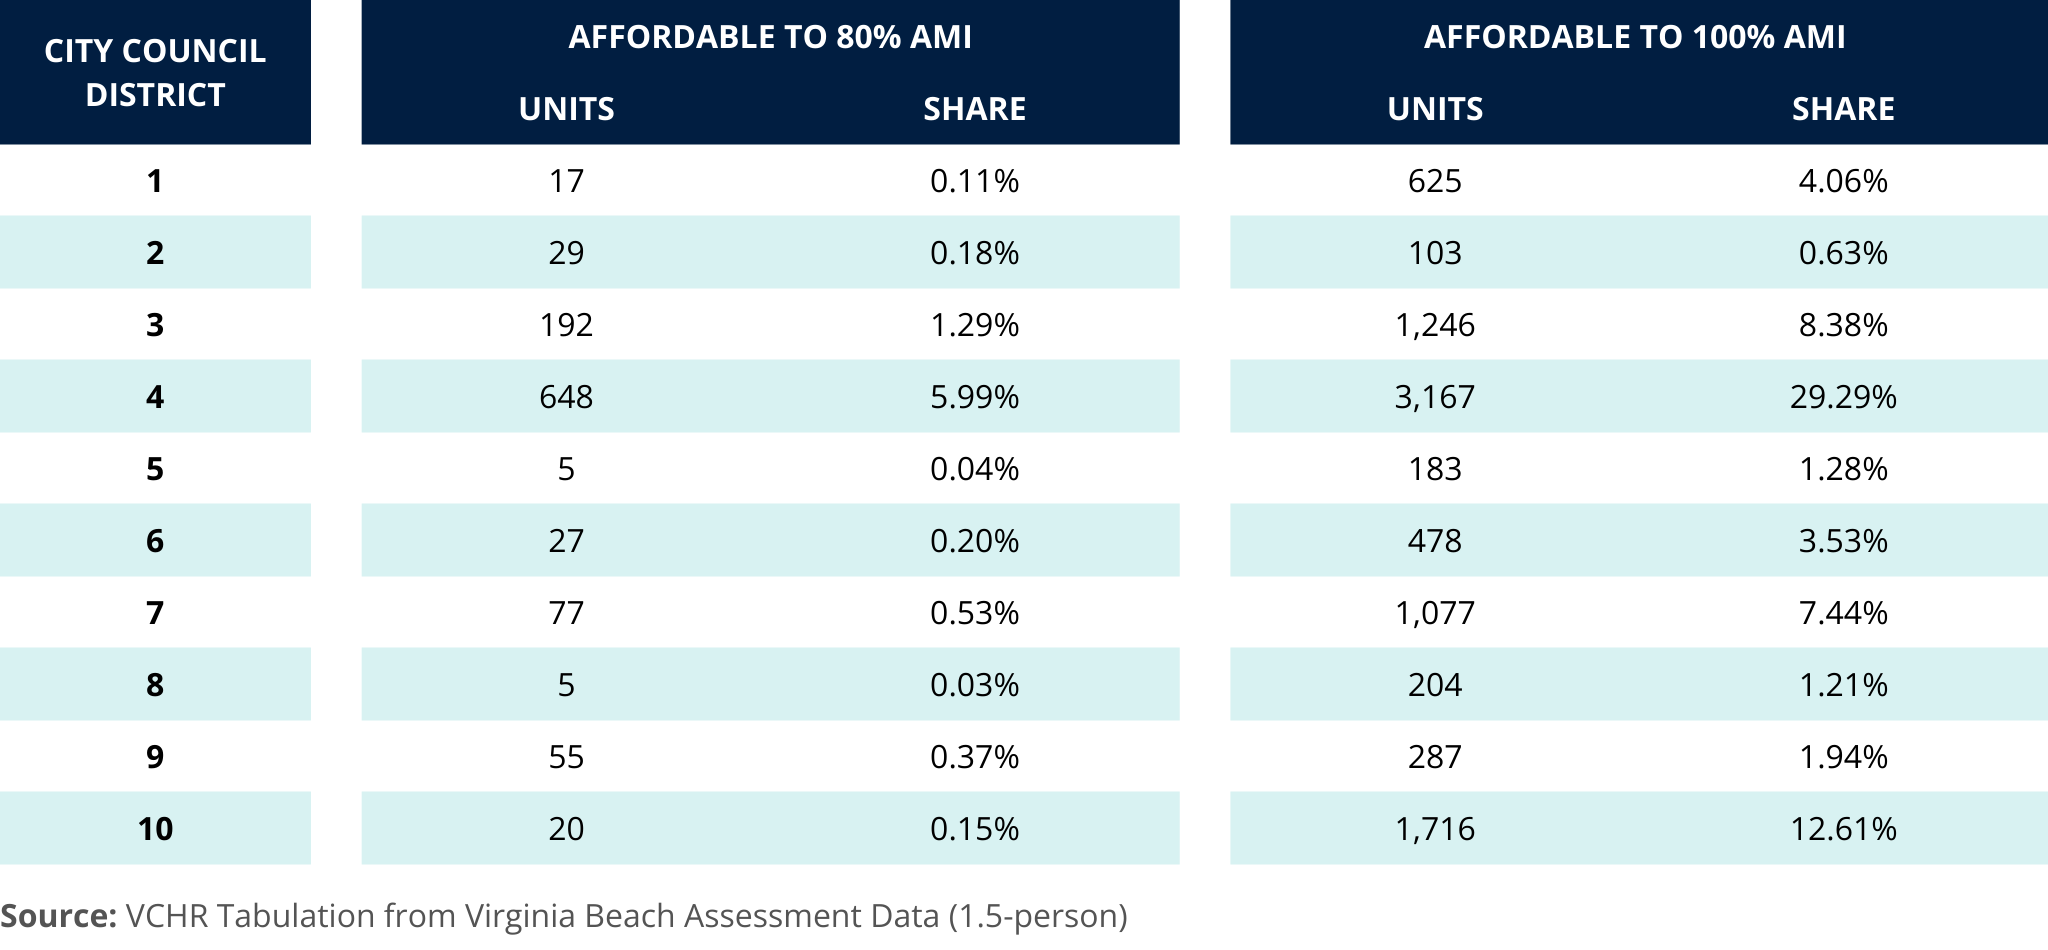
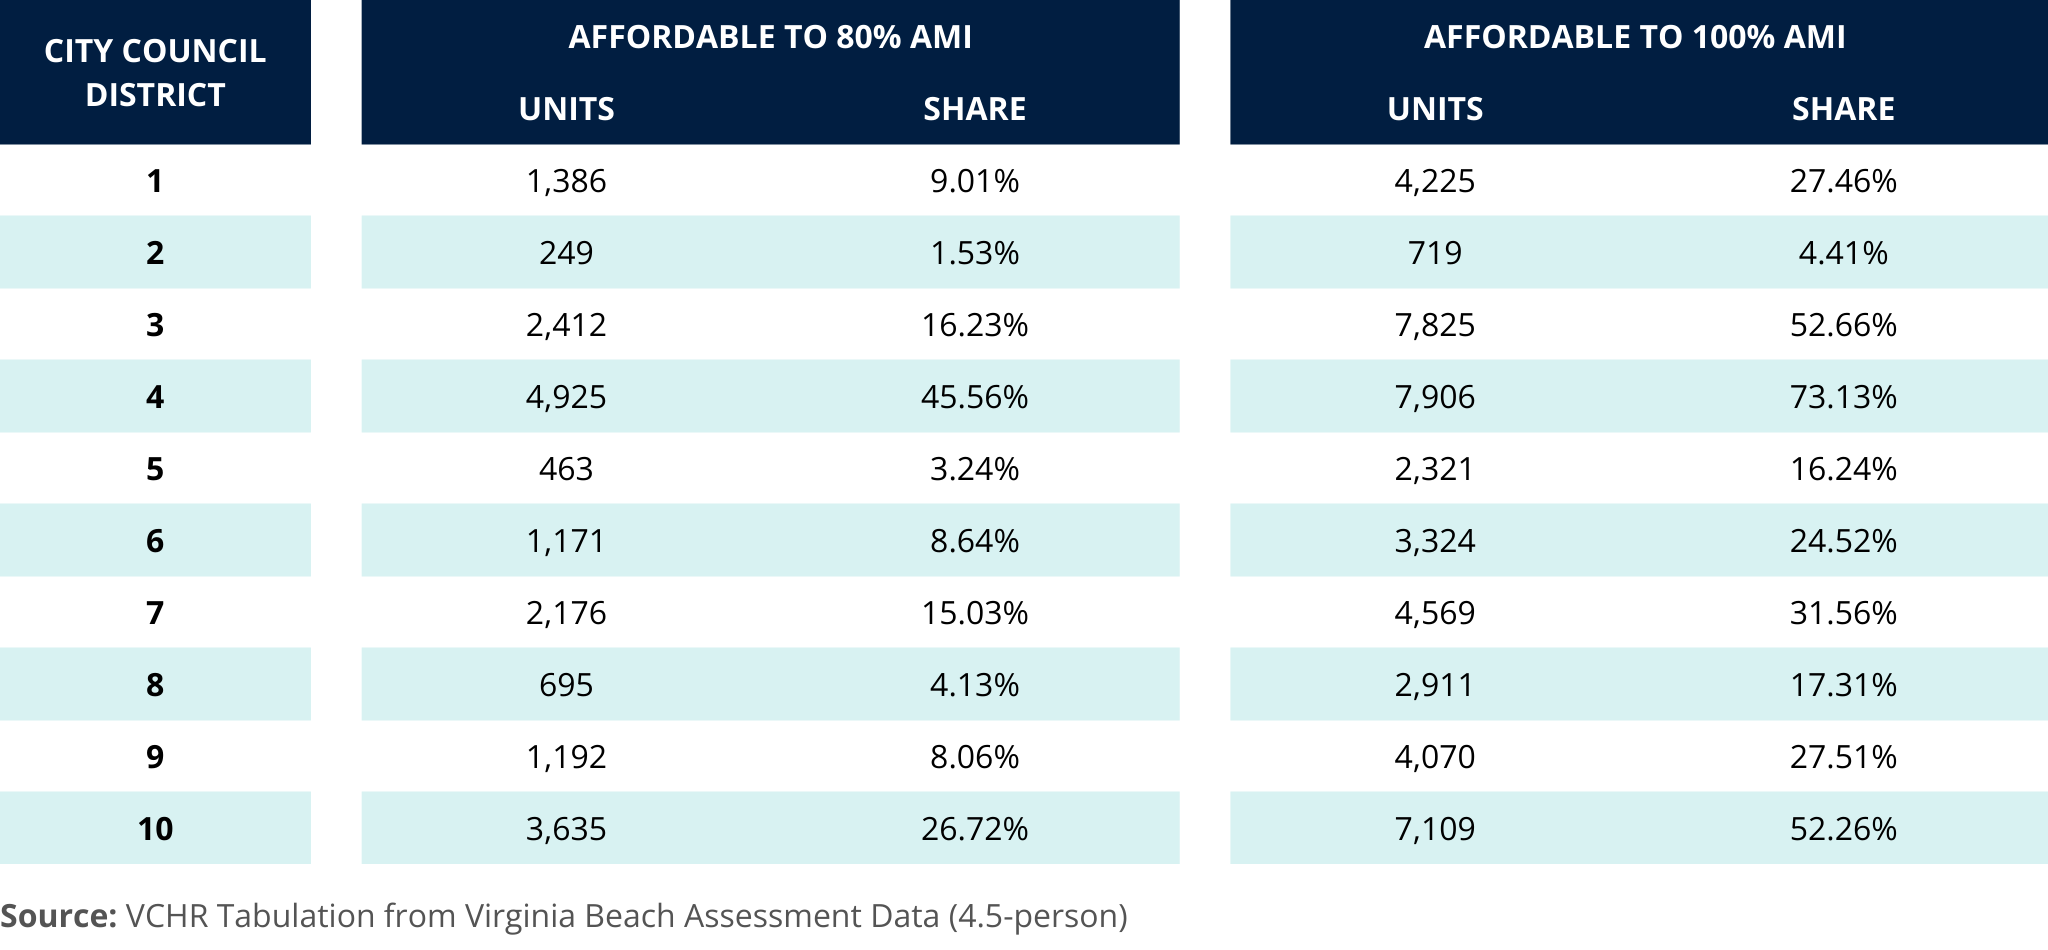
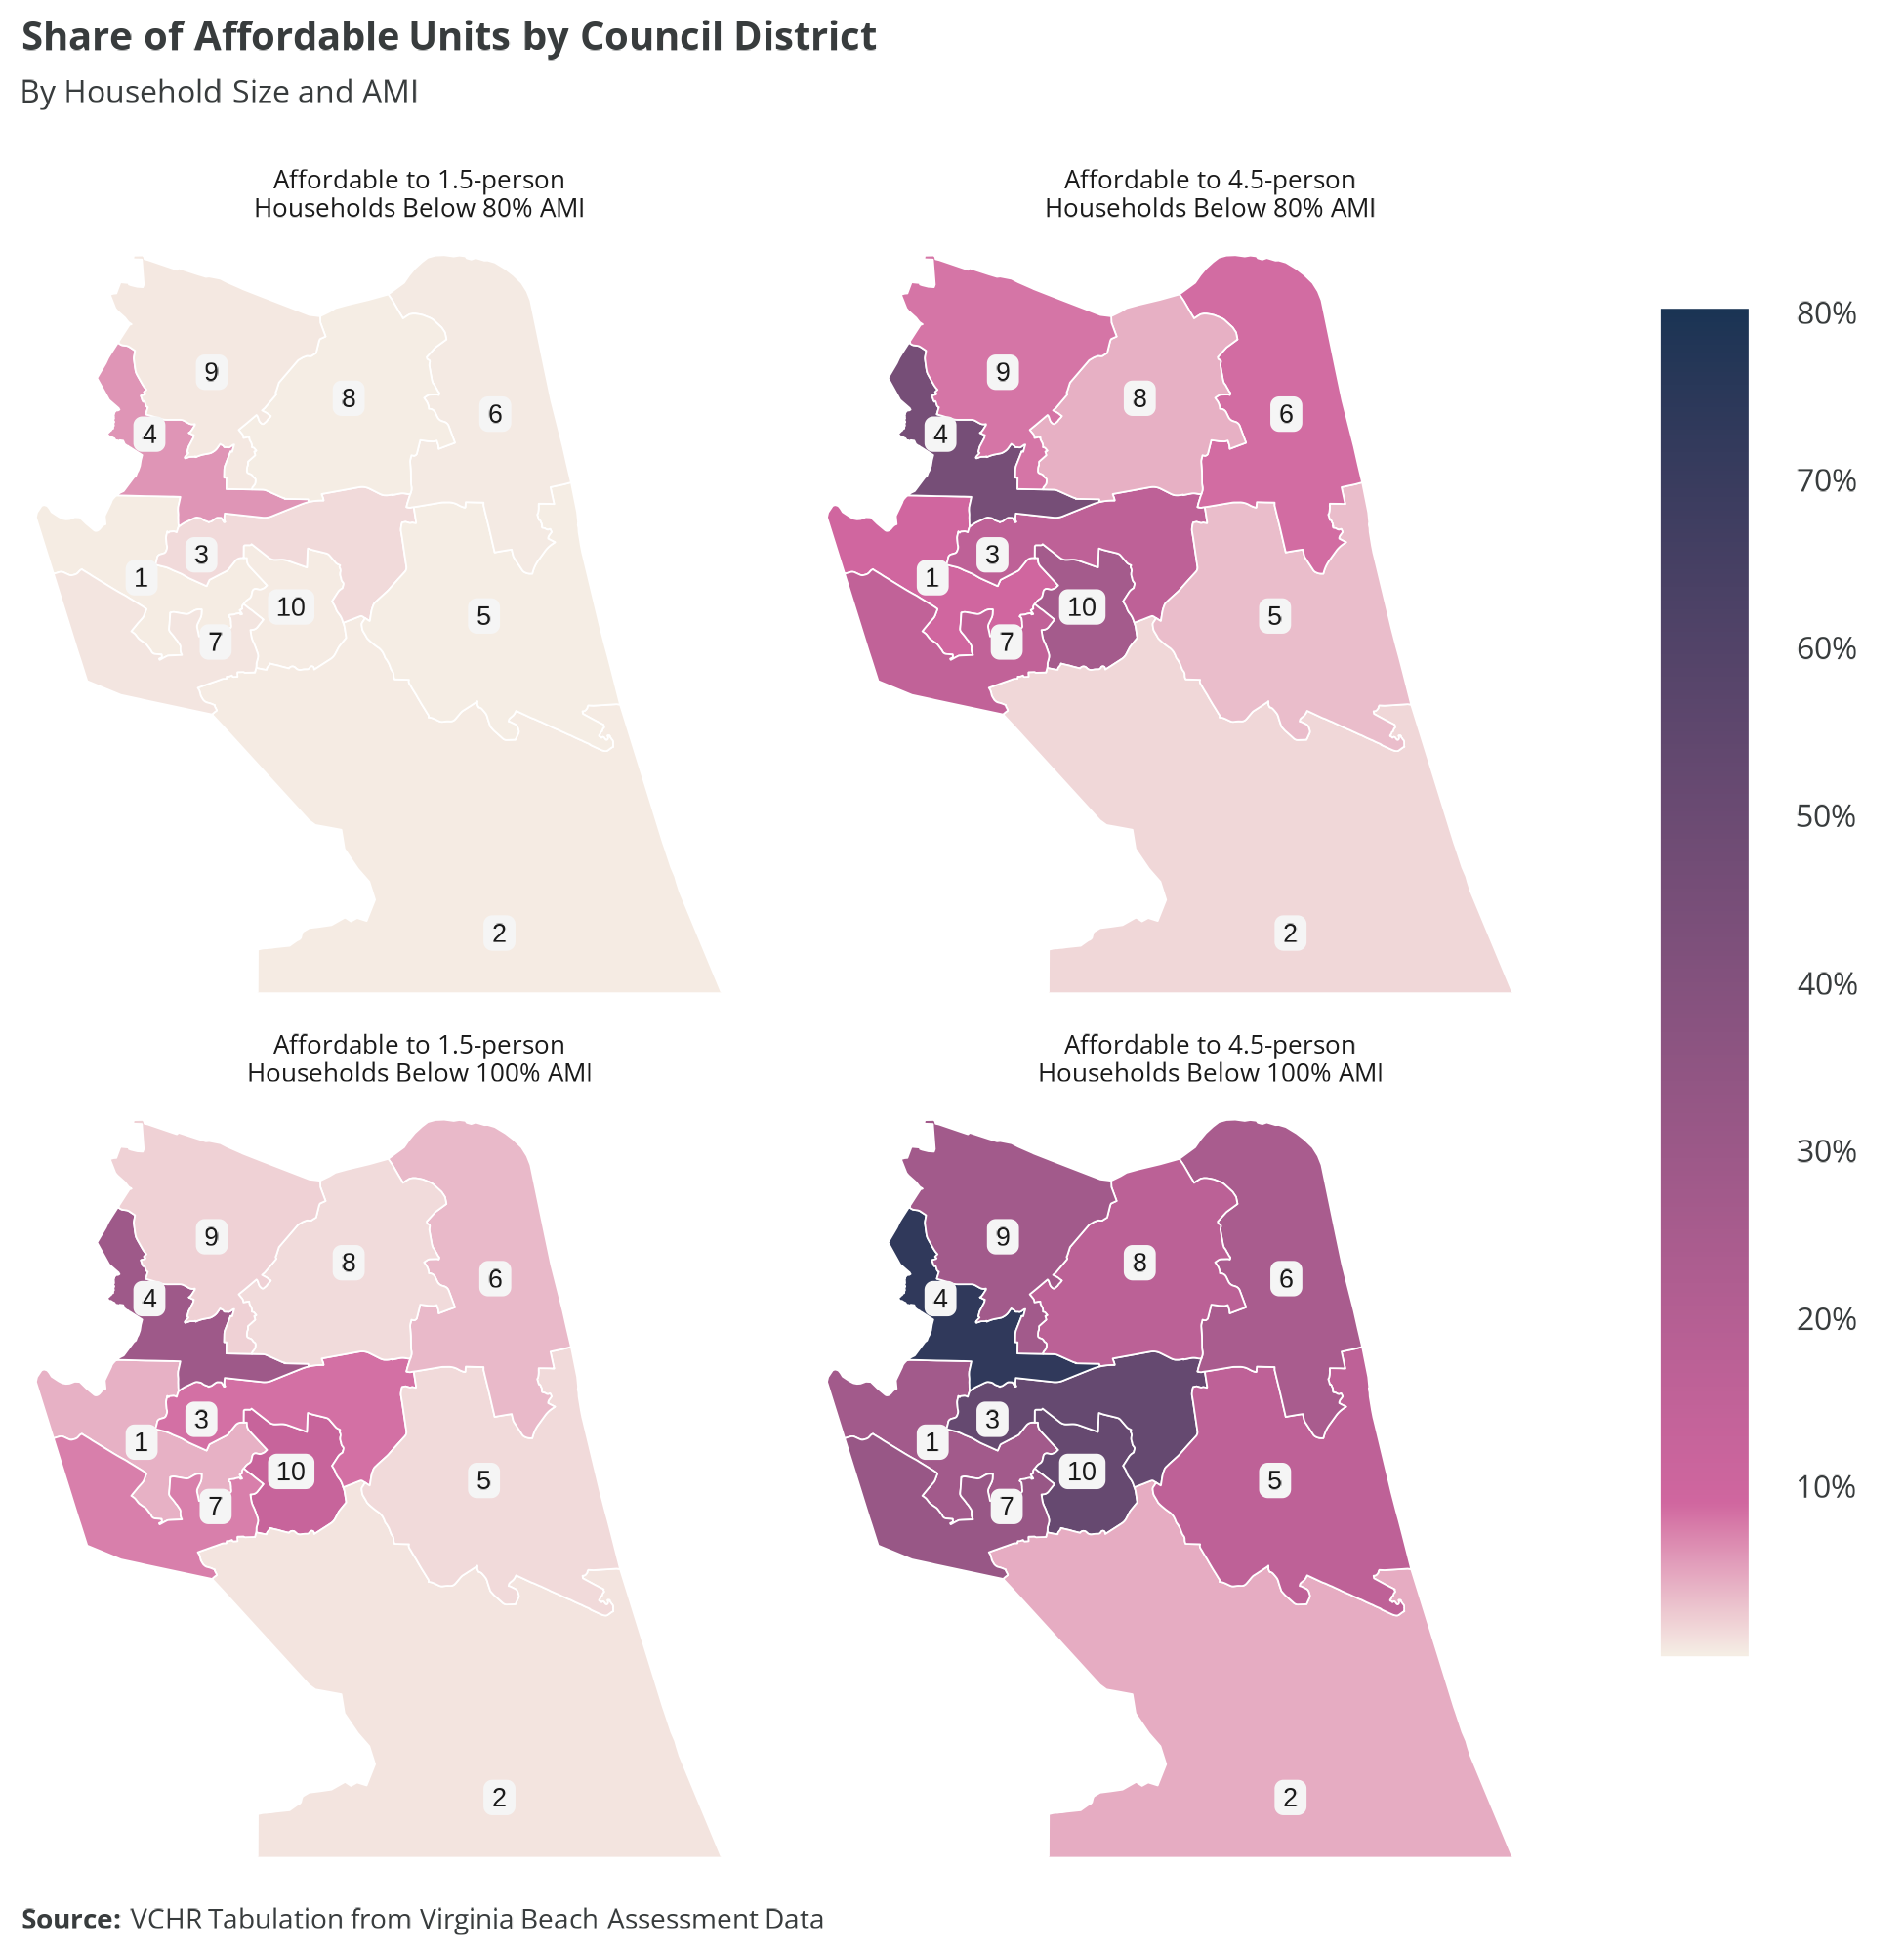
VCHR conducted an analysis of Naturally Occurring Affordable Housing (NOAH) on a City Council district basis for 1.5 persons (1-bedroom) and 4.5 persons (3-bedroom) with a 5% down payment. The assessment was focused on units suitable for households earning 80% or less / 100% or less of the Area Median Income (AMI). The results are presented in Table C.5, Table C.6, and Figure C.1.
City Council District 4 stands out with a higher proportion of affordable units, particularly in comparison to other districts. Around 46% of the units are affordable to households with incomes of 80% or less of the AMI, and 73% are affordable for those with incomes equal to or below 100% of the AMI. On the other hand, City Council District 2 shows a comparatively lower percentage of affordable units. Only 2% of the units are affordable to households with incomes of 80% or less of the AMI, and 4% are affordable for those with incomes equal to or below 100% of the AMI.
C.2 Rental: multifamily units
VCHR applied HUD Income Limits — as well as rules for housing affordability by household size and unit size — to categorize multifamily rental units by affordability level. VCHR completed this analysis for 287 properties included in CoStar data extracted in May 2023. These properties represent 42,021 units, approximately 81% of the American Community Survey's estimated 52,066 multifamily rental units.
Of the 287 properties, 230 properties with 36,367 units are fully "market rate" and do not include subsidy or affordability restrictions. These units span sizes, ranging from studios to 1-bedroom, 2-bedroom, 3-bedroom, and even 4-bedroom units. Among these units with available rent data, 91% are affordable to households with incomes less than or equal to 100% of Area Median Income (AMI).
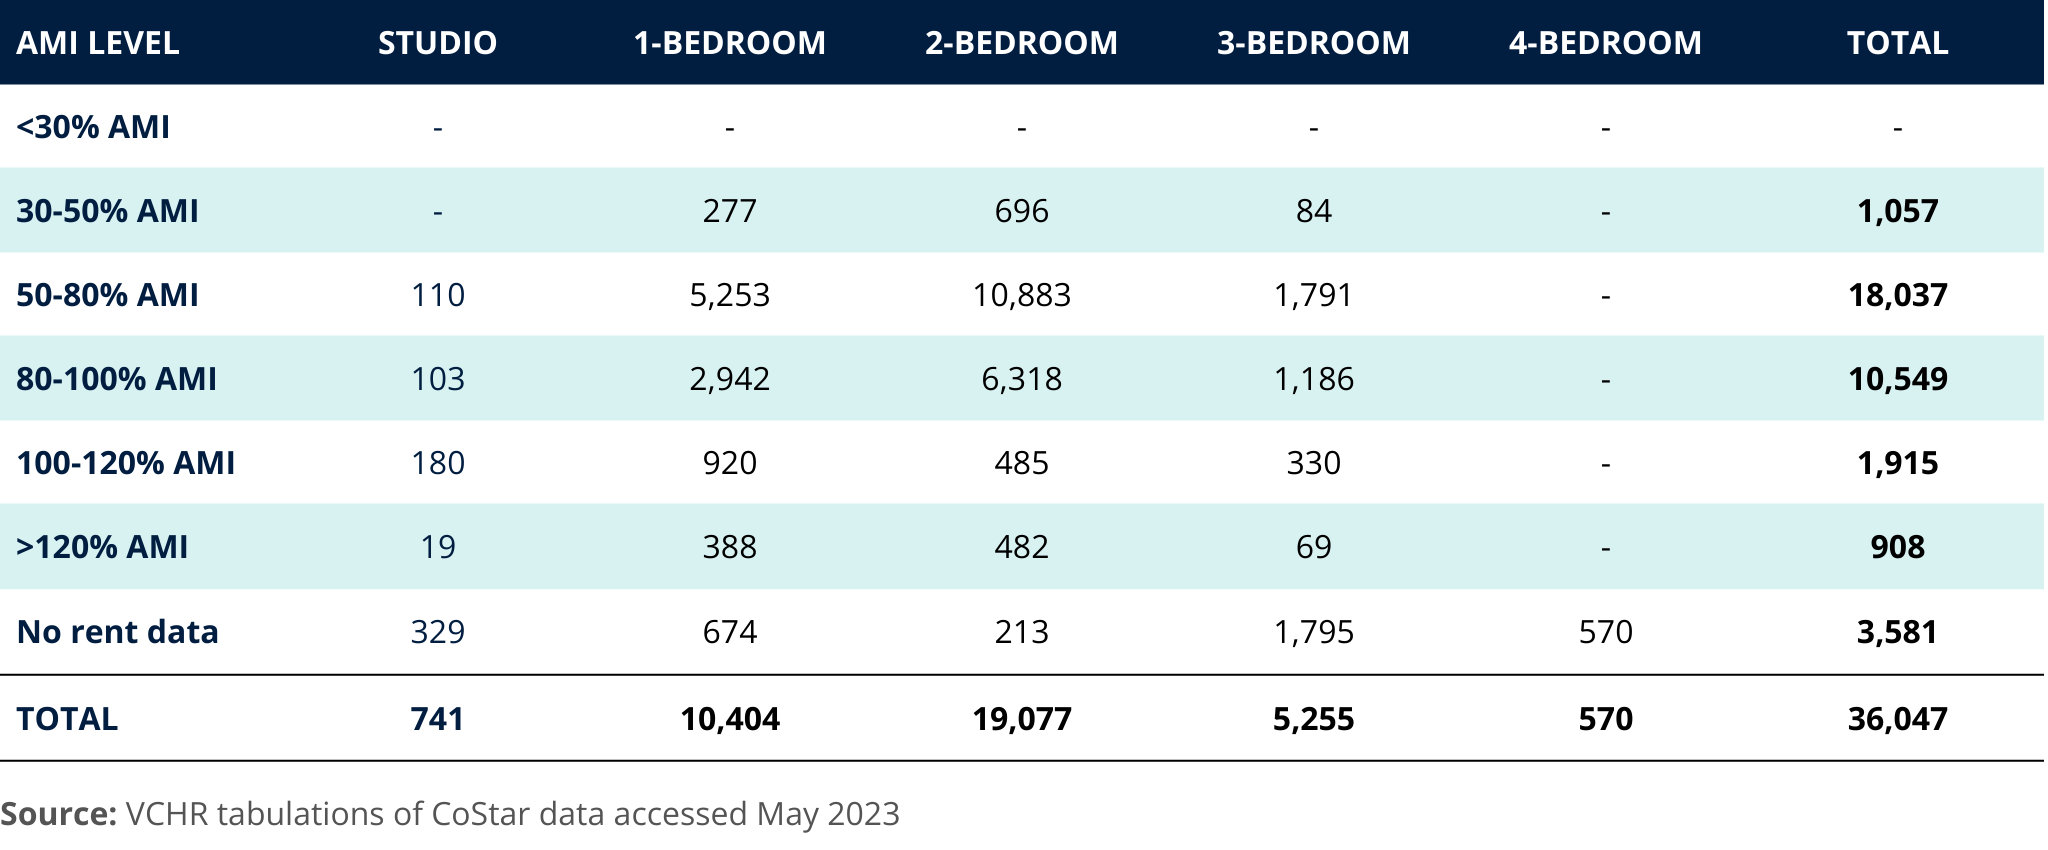
VCHR used the income limits shown in Table C.1 and the associated maximum affordable rent (30% of the income limit divided into 12 monthly rent payments) shown in Table C.7, to categorize units by affordability level. The maximum affordable rent for a 1-person household is applied to studio apartments, the affordable rent for 1.5-person households is applied to 1-bedroom units, the affordable rent for a 3-person household is applied to 2-bedroom units, and the affordable rent for a 4.5-person household is applied to 3- and 4-bedroom units. VCHR adopted this convention from the rules applied by HUD to classify units for the Consolidated Housing Affordability Strategy (CHAS) data tabulations. VCHR used the maximum affordable rents in Table C.7 to set ranges for property-wide average rents by unit type reported to CoStar.
Table C.7 shows the number of market-rate units that are affordable to households by income categories. More than half these units are 2-bedroom units, while 29% are 1-bedroom units. Approximately 16% are 3+ bedroom units, and studios make up only 2%. Nearly 90% of units are affordable to households with incomes 50%-100% of AMI, and few units are affordable to households with very-low or extremely low incomes, below 50% of AMI. This distribution pattern underscores the challenges faced by individuals and families with lower incomes in accessing affordable market-rate units, highlighting the need for more extensive affordable housing options for this population.