4 County market analyses
The following provides a county-level analysis of major trends impacting housing within Central Virginia Planning District region. All data has been disaggregated to show the differences between localities.
4.1 Takeaways
- Domestic migration is driving population growth in the counties — especially in Bedford.
- Amherst’s population is expected to continue its decline for the next several decades.
- Older homeowners are driving much of the growth, while renters are mainly coming to Campbell more and more.
- Income disparities vary by county and racial and ethnic identity, but renter incomes lag behind homeowners regardless.
- Diverse housing is lacking in the counties, especially among the homeowner housing stock.
- Development activity in Amherst and Appomattox has been limited, while Bedford has seen declines in recent years and Campbell has seen increases.
- Homeownership rates have been declining in recent years, except for in Bedford.
- Rents have been relatively flat despite the demand.
- Assisted housing is limited in the counties and cost burden for renters has remained relatively unchanged in the last decade.
4.2 Population trends
From 2010 to 2022, Bedford County has grown more than any other locality in the region, experiencing a 18 percent increase. In fact, as of the 2020 Census, Bedford County was more populous than the City of Lynchburg (79,462 versus 79,009, respectively).
Appomattox and Campbell experienced slight to moderate growth in the last decade, while Amherst County’s population declined by two percent.
Population growth in Bedford and Appomattox can be largely attributed to domestic migration. In Bedford specifically, there has been significant losses in population due to natural decreases, but domestic migration has outpaced those decreases to lead to a net increase in population.
The loss of population in Amherst County has largely been a result of domestic out migration over the decade, but also natural decreases. It was not until recently that Amherst began to see some growth again.
Campbell County’s population changes have been driven by international migration into the county for much of the last decade. And in 2021, domestic migration began to contribute towards growth whereas the county was previously seeing migration out of the county to other parts of the region, state, or nation.
Population projections show that Bedford County will continue to grow at a substantial rate over the next 30 years. Appomattox and Campbell will see slight growth, while Amherst is slated to see more population decline in the coming decades.
4.3 Household trends
The counties are seeing varying changes among homeowner and renter households. Bedford has seen a major increase in homeowners throughout much of the last decade. As of 2021, there were 2,264 more homeowners in Bedford than in 2010.
Appomattox’s growth has been mainly among homeowner households, while renters have declined overall. For Amherst, there has been similar declines in both renters and homeowners.
Meanwhile, Campbell County has seen the greatest increases in renters among the counties. From 2010 to 2021, there was an increase of 650 renter households and a decrease of 412 homeowners in Campbell.
The loss of younger households is common among the counties. The percentage of both renter and homeowner householders 45 years old or less have been declining since 2010. But older renters (45 years old and older) have been coming into the counties. Appomattox, in particular, saw an 81 percent increase in renters aged 45 to 64 years old between 2010 and 2021, while Bedford experienced a 56 percent increase in renters 65 years old and over. The growth in homeowners was predominantly among householders aged 65 years and over, where all counties experienced an over 25 percent increase since 2010.
Although younger householders are declining in the counties, smaller households are increasing. One-person homeowner households are increasing in Amherst, Appomattox, and Bedford. Unlike its neighbors, Campbell is seeing an increase in both one-person renter and homeowner households. Two-person households are overwhelmingly increasing in Bedford.
The counties that did see an increase in larger households were Amherst, Bedford, and Campbell. These increases were mainly among renter households, but Bedford saw an increase of four-person households for both homeowners and renters.
The increases in smaller households may be accounted for by increases in the senior (65 years and over) population. But increasing number of seniors living alone can be of great concern for localities. Although many seniors desire to maintain their independence, professionals note that older adults who live alone are more likely to be poor. Campbell had the largest increase in seniors living alone from 2012 to 2021 (+1,241), followed by Bedford at an addition of 919 seniors living alone.
Rising costs in the region can force families to double up with others. This creates subfamilies, which the Census Bureau defines as:
A married couple (with or without children) or an unmarried parent with one or more never-married children under the age of 18, residing with the householder, but not including the householder’s spouse.
When grown children move back to the parental home with their own children under 18 or a spouse, they are considered a subfamily.
Single parents with children are the most common subfamily type that is experiencing this living situation. But over the last decade, there has been an increasing number of single parents with children living with others in Amherst County. Married couples with and without children are more likely to be in Amherst or Campbell, and their numbers have also been increasing in the last decade.
Adult children living parents can also be an indicator of affordability challenges. Campbell has consistently seen a decrease in the number of adult children living with parents since 2015, an overall decrease of 511 adults between the age of 18 and 34. Although Amherst and Bedford experienced relatively major increases by 2020, changes in the population led to an overall minimal increase (+75) for Amherst and a decrease for Bedford (-37). Appomattox saw the largest increase in adult children living with parents compared to 2015 estimates (+151).
4.4 Economic trends
Across the four counties, renter household incomes skew towards the lower end when compared to their homeowner counterparts, and most lower-income renter households are located in Bedford or Campbell. Homeowner households are more likely to make $75,000 or more, especially in Bedford.
Median household income shows that the typical renter income has continued to lag behind homeowners. The income gap between renters and homeowners has only widened in Amherst County and Bedford, while it has narrowed in Appomattox and Campbell. The latter has largely occurred due to the decrease in incomes for homeowners and rises in renter incomes, while the former is the result of diverging incomes in those respective communities.
The graph below shows the median household incomes of the different racial and ethnic groups for the four counties in 2021. There are varying disparities between groups depending on locality. Hispanic households in Bedford and Appomattox have much higher median incomes than their Hispanic counterparts in Amherst and Campbell. Meanwhile, Black households have median household incomes grouped towards the low-end of the spectrum, except for in Bedford, where Black median household income is comparable to white household incomes in neighboring localities.
The average annual wage for all workers within each county ranges from around $35,000 in Appomattox to around $50,000 in Campbell. Wages for Amherst and Bedford are very similar, coming in just above $40,000 per year.
4.5 Housing stock
The counties contribute to 72 percent of the region’s total housing stock. The majority of that share consists of single-family homes occupied by homeowners. Among the owner-occupied housing stock in the counties, there is little diversity as the only other type of housing with noticeable amounts is the “Other” category, which includes manufactured homes.
Renter housing stock in the counties is diverse, but still largely made up of single-family homes and manufactured homes. Two to four unit homes, like duplexes and quads, can look like single-family housing and can often be more affordable, but the counties only contribute one percent of this type of housing to the region’s total stock.
Bedford and Campbell counties are the two jurisdictions with the largest share of actual multifamily rental units, while Appomattox County has the lowest. Amherst County has the highest share of two to four unit apartment buildings, which make up just over 25 percent of the county’s total rental stock.
Manufactured home communities are prevalent among the four counties. Campbell alone has 41 manufactured home communities, most of which are communities of less than 50 homes. Bedford follows at 30 communities, 22 of which are small communities.
Although many of these communities make up a bulk of rural communities’ affordable housing stock, they are often plagued with housing quality issues. This is due to the prevalence of pre-HUD Code mobile homes located in parks.
Local residential building permits show that the four counties have experienced the Great Recession and subsequent recovery differently. Bedford was on the rise pre-Recession but has struggled to recover to those previous levels, especially throughout the pandemic. But development in Bedford in recent years has focused on multifamily development (5 or more units), where it is undoubtedly centralized in the Town of Bedford.
Campbell was also seeing major growth ahead of the Great Recession but has seen starts and stops throughout the last decade. On the other hand, Amherst and Appomattox have seen little change in their building permit trends over the last two decades.
Regardless of these changes, there is a severe lack of diverse housing being built in the counties. Homes like duplexes are virtually non-existent in the development pipeline.
4.6 Homeownership market
Homeownership rates vary across the four localities. Bedford has the highest homeownership rate at 84 percent, while Campbell has the lowest at 73 percent. Appomattox and Campbell were initially seeing rising homeownership rates throughout the first half of the decade, but those gains began to turn to losses in the second half. For Amherst, decreasing homeownership is a recent trend from 2020 to 2021 and it is uncertain whether this will continue.
Bedford’s homeownership rate was affected by the reversion of the city to town status, but in recent years, homeownership has been rising dramatically.
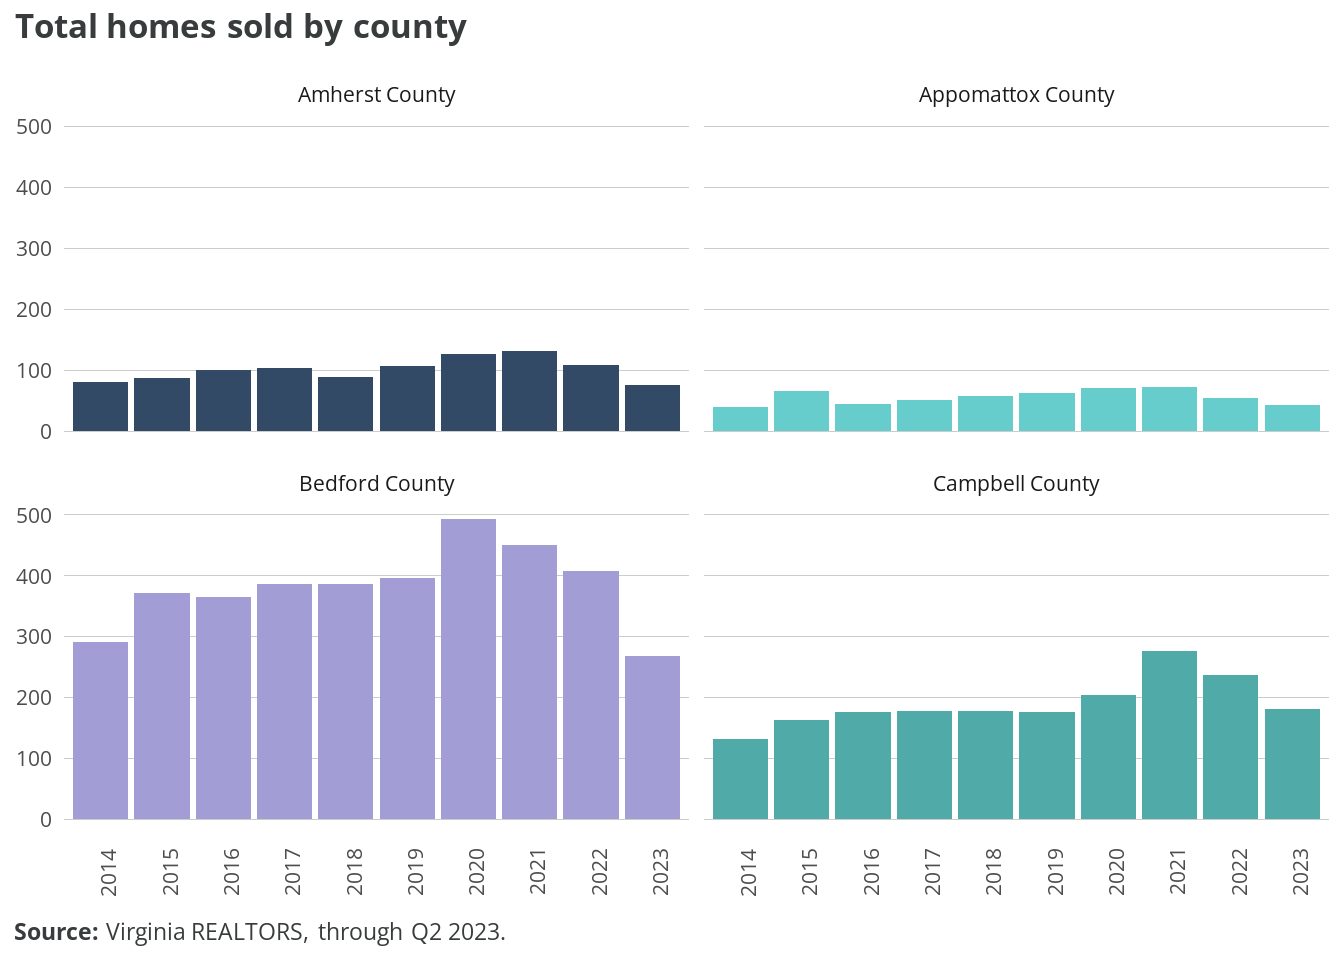
From Q2 2019 to Q2 2023, the median sales price in the counties has risen by at least $50,000. The most substantial increases were in Bedford and Appomattox.

Many counties saw a bump in homes sold during 2020, no doubt a result of the pandemic’s impacts on interest rates coupled with an increasing number of millenials ready for homeownership. Bedford County has consistently exceeded its neighbors in the number of home sales, followed by Campbell County. More recently, home sales have been in decline in from 2021 to 2022. With rising interest rates that now sit around 7.0 percent, the hot market of the pandemic has started to cool. But prices continue to rise as supply wanes and demand maintains.
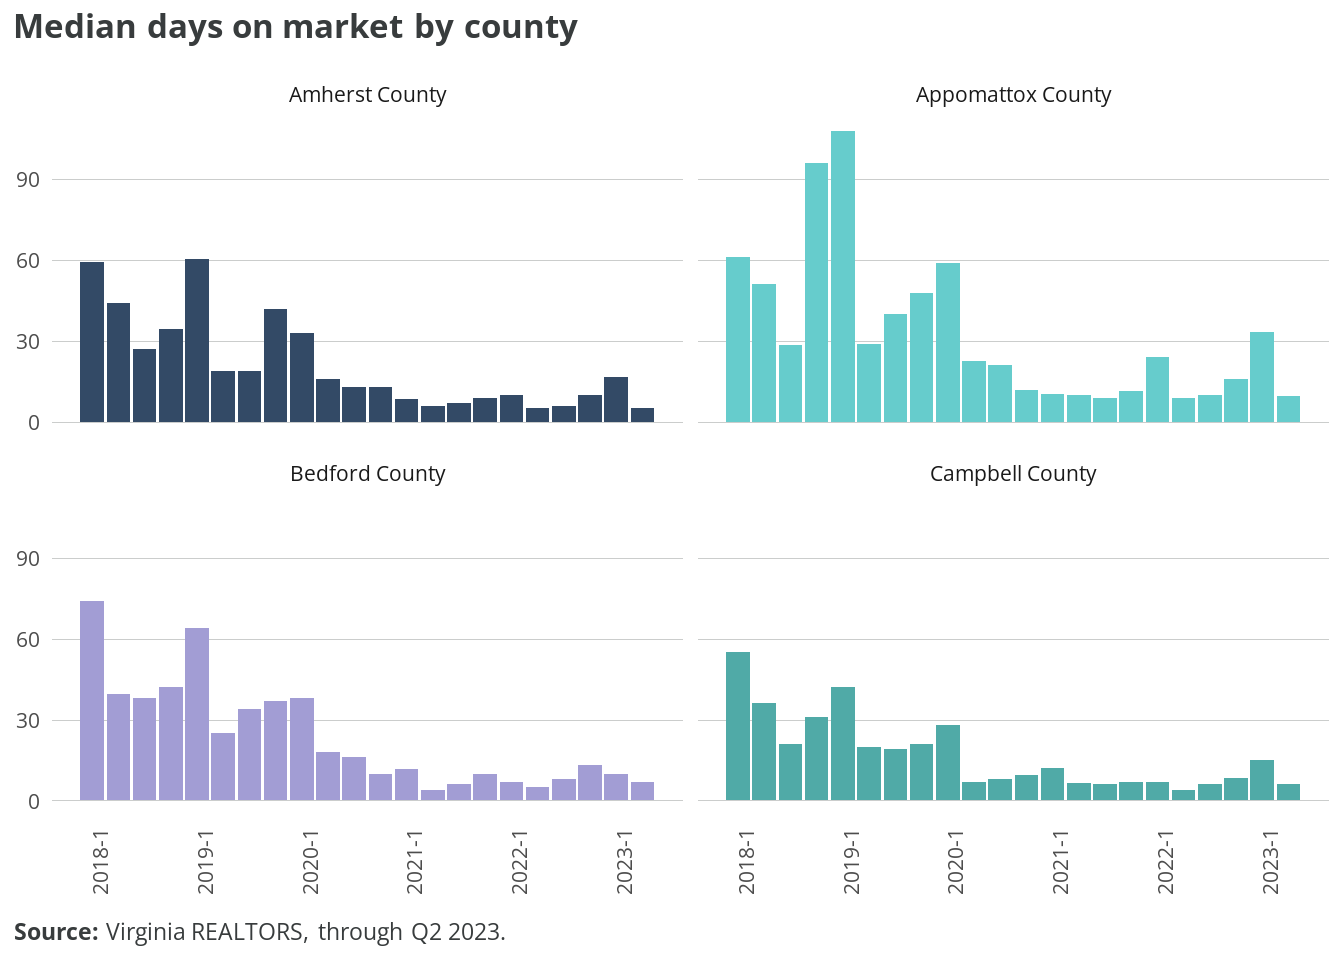
As an additional indicator of demand, the median days on market shows how the pandemic shifted the market in the region. While 30 days on market is a typical measure in a balanced market, the median days on market has not been above 20 days since the end of 2020 in every county (except for a few instances in Appomattox County).
4.7 Rental market
From 2016 to 2020, rental housing costs in the counties have remained relatively flat (relative to inflation). Since then, rents increased significantly in Bedford and Campbell counties. This growth coincided with rising inflation, so increases have not been significant in constant dollars. However, that adjustment does not account for the much more limited increases in renter incomes in recent years.
Note
The CoStar data used for this section does not have complete coverage of smaller scale rental properties, such as single-family homes and duplexes. Average rents are primarily sourced from larger, professionally managed apartment communities.
As a result, the sample sizes for Amherst and Appomattox counties—whose rental stock is more significantly comprised of small scale units—are small. Data for these localities should be viewed with caution.
Rental vacancy rates among multifamily housing in Amherst and Appomattox have remained steady just below, and above, 5 percent, respectively. In Bedford, vacancy rates have also ranged around 5 percent, with a slight increase in the last year.
Baseline vacancy in Campbell is very low, with the exception of several temporary sharp increases. These likely reflect a significant number of new units coming online at once, followed by lease-up over the following months.
Rental housing supported by federal subsidy in the counties is most likely to be found in Bedford, no doubt a result of the former City of Bedford’s inclusion in the data. Most of the subsidized housing in the counties is made up of project-based Section 8 rental housing (306 units, most of which resides in Bedford). The second most common subsidized housing is the Low-Income Housing Tax Credit (LIHTC) (282 units), then followed by the Rental Housing Section 515 Program administered by the U.S. Department of Agriculture (USDA) (266 units).
Note
For more information about these federal housing programs, please visit the National Housing Preservation Database’s Program Descriptions page.
Campbell is not represented among federal housing programs, but it is important to note that these estimates on affordable housing do not include tenant-based assistance like Housing Choice Vouchers (HCVs) or state-funded programs.
Housing Choice Vouchers allow low-income individuals and families to find housing in the private market. HCVs serve as rental assistance to help households pay for housing that may exceed the value of the voucher. HCVs can also be project-based vouchers, meaning that a housing authority can re-allocate funding to tie a tenant-based voucher to a specific housing development.
In the counties, there are 248 HCVs being used by low-income households. Forty-two percent of those vouchers are being utilized in Campbell County.
4.8 Affordability
Locally, trends in cost burden follow regional patterns of decreasing cost burden as a whole. But while cost burden for homeowners have been decreasing in each of the counties, renter cost burden has remained relatively unchanged over the last decade.
Cost burden by race and ethnicity shows that white households across all four counties are less likely to be cost-burdened. This has been consistent since 2012.
Caution
The margins of error for Asian and Hispanic households, as well as other minority groups in the region (multiracial households included), are significantly high. This is most often due to the small sample sizes. For this reason, we have excluded them from the data visualization.
As at the regional-level, extremely low- (30 percent AMI or less) and very low-income (31 to 50 percent AMI) households face greater cost burden than their higher income counterparts. But in Amherst and Campbell, nearly one in five low-income household (51 to 80 percent AMI) are cost-burdened. In Bedford, that share is closer to one in four. Very few households above 80 percent AMI have significant trouble with housing costs.
In Amherst and Bedford, non-elderly, non-family households (i.e. individuals living alone or with unrelated persons) were more likely to be cost-burdened than any other household type, 37 and 30 percent cost-burdened, respectively. Meanwhile, in Campbell, 31 percent of elderly, non-family households (i.e. seniors living alone or with unrelated persons) were cost-burdened in 2020.
These two household types face the most difficult challenges in affordability, most likely due to the challenges of affording housing alone. But interestingly, just over four in ten large families in Appomattox are cost-burdened, a divergence from trends in the other three counties.
The chart below shows whether renter households are currently living in affordable or unaffordable apartments, broken down by Area Median Income (AMI) up to 80 percent AMI. For example, among all renters at or below 30 percent AMI in Amherst County, 355 are able to afford their current home, while another 320 cannot.
This represents a rental housing “gap” of more than 300 homes that must be created or made affordable to alleviate cost burden among those renters. Across the region, this gap is most severe for renters below 50 percent AMI. Very few renters between 50 and 80 percent AMI currently struggle to afford their home.
Caution
As of September 2023, the latest available CHAS estimates published by HUD are based on the 2016-2020 American Community Survey 5-year estimates. Therefore, these estimates do not reflect changes that have occurred since the beginning of the COVID-19 pandemic.
There are undoubtedly other factors that impact housing affordability that CHAS data does not take into account. The following estimates should serve as a baseline estimate of need.
Across all four counties, the rental housing gap below 30 percent AMI is 1,809 units, 949 units between 30 and 50 percent AMI, and 105 units between 50 and 80 percent AMI. The total rental housing gap is 2,863.