3 Regional market analysis
The following provides a regional-level analysis of major trends impacting housing within Central Virginia Planning District region. All data has been aggregated to the regional-level and includes:
- Amherst County
- Appomattox County
- Bedford County
- Campbell County
- City of Lynchburg
3.1 Takeaways
- Population growth as a result of domestic migration due to COVID-19 pandemic
- Growing renter population — particularly a growing higher income renter population
- More and more smaller households coming to the region
- Continuing income disparities — between white and Black households
- Loss of smaller sized housing
- Major home price increases and rental vacancy declines due to COVID-19
- Affordability challenges hitting people of color, renters, and those living alone the most
3.2 Population trends
3.2.1 Total population
From 2010 to 2020, the Lynchburg region only grew by six percent, an increase of just over 15,000 people. This slow but steady growth across the last decade was punctuated by a slight decrease in population between 2019 and 2020. In more recent years, the population has recovered to its 2019 estimate, now having an estimated population of 263,613 as of 2022.
For much of the last decade, growth in the region has been a result of both domestic migration and international migration. But from 2020 to 2021, there were significant shifts in the causes of population change. Deaths outpaced births during this time, leading to a loss of over 600 individuals. International migration decreased, while domestic migration overwhelmingly became the reason for growth in the region.
These changes within the region were no doubt a result of the COVID-19 pandemic’s impact. With the increase in work-from-home (WFH), households from outside the region saw an opportunity to benefit from the relative affordability of the region, while still earning high wages from elsewhere. And sadly, the pandemic’s impact also contributed to losses among the community.
Recent changes in the population from 2020 to 2022 have shown the overwhelming impact of domestic migration to the region. The natural decreases post-2020 have been substantial for the region, resulting in a loss of 1,100 residents from 2020 to 2022.
3.2.2 Population projections
Despite the slight population decline from from 2019 to 2020 and the slow growth in recent years, the region is projected to near 300,000 people by 2050 — a 13 percent increase from the 2020 Census.
3.3 Household trends
3.3.1 Household tenure
From 2010 to 2021, there has been a continuous increase in the number of renter households in the region. Cumulatively, there has been an increase of 3,226 renters since 2010. Although, there has been a cumulative increase in the number of homeowner households since 2010 — that increase is only recent as of 2020 and 2021.
3.3.2 Householder age
The growing number of homeowners in the region are overwhelmingly the result of seniors (65 years and over). Between 2010 and 2021, there was an increase of 5,796 senior homeowners. The growth in homeowners was offset by major decreases in homeowners aged between 25 and 64 years old — an overall decrease of 5,180. Renter households saw increases across all age groups, but the greatest increase was among 45 to 64 year olds (+1,323).
3.3.3 Household types
Among household types, householders not living alone grew by 1,430 from 2010 to 2021 — more than any other household type. This household type mostly represents households with unrelated household members (i.e. living with roommates). Household types like this are expected in regions with major universities, but they can also be an indicator of affordability challenges as individuals increasingly need additional household members to contribute to rent or mortgages.
Householders living alone follow at an increase of 1,133. Household formation continues to be delayed among many individuals — contributing to the growing number of one-person households. But in the Lynchburg region, married couple households follow closely behind with an increase of 1,059 since 2010.
The region saw its greatest gains among households — both homeowners and renters — with two people or less. Two-person renter households saw the most growth between 2010 and 2021, increasing by 2,409. Household with three or more people only grew slightly, but three-person homeowner households actually saw a decline (-1,642).
3.3.4 Seniors and individuals with disabilities
The senior population grew by 9,021 individuals from 2012 to 2021. Much of that growth occurred among seniors living with family — mainly as a householder (+3,233) or as the spouse in a family (+3,091). The third largest change in the senior population was among seniors living alone (+2,291). This senior living arrangement can be a concern for communities. With more and more seniors living alone, aging-in-place is made more difficult without support from others.
Ambulatory difficulties (serious difficulty walking or climbing stairs) among adults presents challenges when it comes to accessible and affordable housing. These individuals often need single-story homes that have been retrofitted to make getting around easier. The number of adults with an ambulatory difficulty in the region has declined only slightly over the last decade from 18,264 in 2010 to 17,753 by 2021, a 511 person decrease.
The number of adults with an independent living difficulty has also seen little change over the past 10 years. Although there was a decline from 2020 to 2021, there are still over 13,000 adults in the region who have difficulty living by themselves.
3.3.5 Subfamilies and multigenerational households
With housing affordability becoming more and more of a challenge for families, some families are forced to live with others. This creates subfamilies, which the Census Bureau defines as:
A married couple (with or without children) or an unmarried parent with one or more never-married children under the age of 18, residing with the householder, but not including the householder’s spouse.
When grown children move back to the parental home with their own children under 18 or a spouse, they are considered a subfamily.
Within the Lynchburg region subfamilies are more than likely to be single mothers. But in recent years, the number of single fathers and married couples (both with and without children) living with another family has been on the rise.
While more and more families are living with other families, the number of multigenerational households has also increased in recent years — especially within Lynchburg and Campbell County, where the percentage of the population living in multigenerational households increased 2.4 percentage points from 2016 (5.5 percent) to 2020 (7.9 percent).
While other parts of Virginia are seeing an increasing number of adult children returning home to live with parents, this is not so much the case in the Lynchburg region. Young adults (18 to 34 years old) are increasingly living with a partner in the region, a 38 percent increase between 2015 and 2021. Adults living with their parents only increased by 1.5 percent during this same timeframe.
3.4 Economic trends
3.4.1 Household incomes
In the region, the distribution of homeowner incomes have shifted upwards. A greater share of homeowners are now in the $100,000 and more income range than back in 2010. Renter incomes have also shifted upwards but not as dramatically towards the upper income bands. In 2021, there 5,060 more renter households making between $50,000 and $149,999, a 92 percent increase.
Regardless of these shifts, income distributions for renter households continue to skew towards the low end.
Note
Comparing constant dollars versus current dollars can be explained in simple terms as follows:
Constant Dollars: Imagine you have a time machine that can make money from different years all have the same value as today’s money. When you compare things in constant dollars, you’re looking at how much something would cost or be worth if prices never changed from a specific year (like a base year). It helps us see how things have changed without the influence of inflation.
Current Dollars: Current dollars are just regular money you use every day. When you talk about something in current dollars, you’re considering its actual, unadjusted value in today’s money. This is how we usually think about prices and incomes.
Here’s an example to illustrate the difference:
Let’s say you earned $5,000 in 1990, and you earned $10,000 in 2020. In current dollars, you’d think you earned twice as much in 2020, which sounds great! However, when you adjust those dollars to constant dollars (like making 1990 dollars as valuable as 2020 dollars), you might find that $5,000 in 1990 is actually worth more like $9,000 in 2020 dollars because of inflation.
So, comparing constant dollars helps us see the “real” change in value over time, considering the impact of inflation, while current dollars are just the actual amounts you earned or spent without adjusting for inflation.
Between homeowner and renter households there is a $35,236 gap in median household income. Adjusting for inflation shows that median household income has been relatively flat for homeowners in the last decade (7 percent increase), while the typical income for renters saw modest gains (18 percent increase).
Gaps in income between different races and ethnicities in the region continue to further racial inequities — especially in the housing market. Black households in the region make a fraction of what their white counterparts make. For every dollar a typical white household makes, a Black household only makes 62 percent of that dollar.
Hispanic households in the region have made major gains in income. When comparing inflation-adjusted income, Hispanic households in the region saw a 17 percent increase in median household income, the largest gain among any other group.
3.4.2 Wages
Note
Wage data in this section is sourced from the Occupational Employment and Wage Statistics (OEWS) program of the Bureau of Labor Statistics. OEWS is updated annually, most recently for 2022 data. This dataset provides a rich look into wage distribution by industry and occupation.
However, OEWS is only available at the national, state, and metro levels. Therefore, the data below covers the full Lynchburg, Virginia Metropolitan Statistical Area (MSA).
Like other regions in the state, regional wages increased across the board from May 2019 to May 2022. The largest percent increases in average wages were among jobs that paid at and below the median wage. In fact, the largest growth occurred in the lowest 10th percentile of wages, due in large part to state lawmakers adopting incremental increases to Virginia’s minimum wage in 2020. The first increase from $7.25 to $9.50 per hour took effect in 2021.
Note
Today, state minimum wage is $11.00 per hour. Under current law, it will increase again to $12.00 in 2023. Lawmakers must reenact the measure by July 2024 to initiative further increases to $15.00 per hour by 2026.
Over this same period, wages in the region grew for all five of the most common occupation categories by total employment numbers. Workers in the Food Preparation and Serving Related sector saw the largest increases—from an average annual salary of $19,950 to $25,680 (nearly 30 percent).
Jobs in Production, Transportation and Material Moving, Office and Administrative Support, and Sales and Related sectors—totaling 46,610 in the region as of May 2022—also saw wage growth more than the 13 percent average increase.
3.4.3 Unemployment
Through much of the early parts of the pandemic, the Lynchburg region saw record high unemployment rates, topping out at 10.5 percent in April 2020. This rate surpassed the post-Recession fall out when the unemployment rate was 8.7 percent in February 2010.
More recently, employment recovery post COVID-19 brought about a record low unemployment rate in November 2021. But recent trends are showing growing unemployment on par with pre-pandemic levels.
3.5 Housing stock
3.5.1 Housing type
The bulk of the region’s housing stock is composed of single-family housing (74 percent). Much of the single-family housing stock resides in homeownership, but in 2015 single-family housing decreased roughly two percentage points from homeownership towards rental. Manufactured homes, which is included in the Other category, has continued to make up the second largest portion of the region’s housing stock (10 percent overall).
Rental housing stock is diverse and has grown to include duplexes, tri-plexes, and quads, as well as larger multifamily properties. While these smaller multifamily properties like duplexes once made up nearly two percent of the homeownership market, they have reduced to a half of a percent of the region’s entire housing stock.
Options like these have been touted as Missing Middle Housing, which are able to offer affordable homeownership options.
Most of the region’s housing is surpassing 20 years in age. A construction boom in the late 20th century (from 1960 to 1999) contributed to much of the region’s homeownership and rental housing stock. With aging housing stock, housing quality becomes an ever-present issue.
The number of smaller bedroom homes has been declining since 2010, particularly within the existing homeowner housing stock. From 2010 to 2021, there was a loss of 2,435 two-bedroom homes in homeownership. Some of that loss could be accounted for in a transition to rental, but two-bedroom rentals only increased by 1,487. One-bedroom rentals, often in-demand by young professionals, as well as those most in need, also a decline (-191), but two-bedroom rentals accounted for much of the rental market growth.
Larger homes with three or more bedrooms saw the greatest increase in the region. Although larger homes are meeting a demand, they often come at the expense of affordability.
Manufactured home communities are spread out across the region. These homes often serve as market-rate affordable housing, but they face several challenges, including risk of redevelopment, poor housing quality, and aging infrastructure.
There are 99 manufactured home communities in the region. Three quarters of the communities in the region are small, consisting of less than 50 homes.
Manufactured homes: a valuable resource
Manufactured homes have faced significant stigma due to their association with mobile homes or trailer homes built before 1976. In 1976, the manufactured home industry and the federal government created stricter standards for the construction of these homes. The HUD Manufactured Home Construction and Safety Standards (the “HUD code”) has helped ensure that manufactured homes are safe and high quality.
Despite the HUD code, many pre-1976 mobile homes persist across the nation — especially in mobile home parks. In many instances, residents of these homes face significant challenges in energy efficiency, weatherization, and housing stability. At the same time, older manufactured homes act as many rural communities’ stock of affordable housing.
Manufactured housing is a valuable source of housing that should not be ignored. New technologies and materials are continuing to increase the quality of manufactured homes.
3.5.2 Building trends
The region has still not recovered to its Great Recession building-levels, when residential building permits peaked at 1,840 in 2005. Since 2012, permits have only averaged at 768 per year, less than half of what it was in 2005.
In addition, the early 2000s saw a greater number of two to four bedroom homes. But by 2005, these diverse types of housing were nearly non-existent from the building pipeline in the region.
3.6 Homeownership market
The regional homeownership rate has been on a slow decline in the last decade, from 72 percent in 2010 to 70 percent in 2021.
As the homeownership rate has declined slightly, the regional median residential sales price has continued to climb in recent years. Although fluctuating between $180,000 and $225,000 between 2016 and 2019, the region saw a major bump in early 2020 as the pandemic impacts hit the region’s housing market that have kept home prices well-above $225,000 ever since.
The impact of the pandemic is most noticeable when looking at the number of closed home sales and average days on market. The region saw record high closed home sales during the summers of 2020 and 2021, when it hit 435 sales in June 2020 and then 448 in June 2021.
The demand in the region is further exemplified by the dramatic decline in average days on market. Already on the decline since 2017, the region hit record low average days on market in middle of 2021. Since then, homes have remained below an average of 40 days on the market.
With increasing mortgage interest rates in recent months, home sales, as well as prices, have seen declines. But prices will continue to rise, although not as rapidly as during the early aughts of the pandemic when record low interest rates opened up housing opportunity for many who could not have afforded a home otherwise.
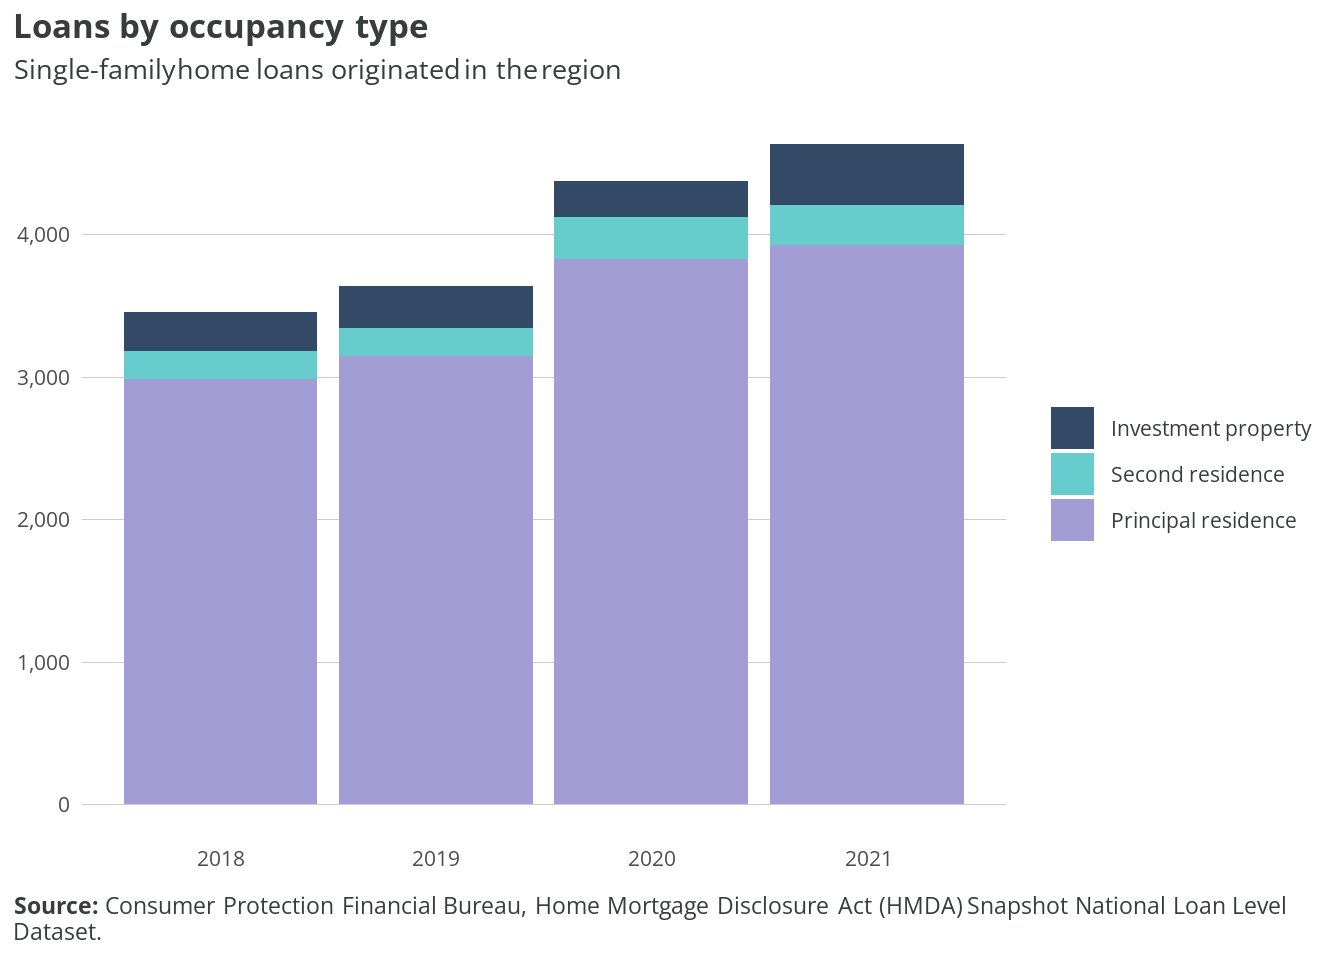
Loan originations for a home purchase saw a boost between 2019 and 2020, increasing by 20 percent. The proportion of home loans for an investment property saw the largest increase, making up only about 6 percent of loans in 2018 to being almost 10 percent of all home loans in 2021.
3.7 Rental market
While the rent value in each year seemingly shows that rent has grown significantly from 2016 to mid-2023, inflation adjusted values shows that rent has changed very little.
Average rent for the region has been relatively flat since 2016 when adjusted to current dollars. The average market asking rent was $1,132 in the first quarter of 2016 in inflation adjusted dollars. By the second quarter of 2023, the typical rent in the region had only increased by $4 to $1,136. While the changes in rent values may be small, the impact on households whose incomes have not grown is still significant.
In spite of the minute changes in average rent over the past few years, the rental vacancy rate took a major dip in the second half of 2020, reaching a low of 3.5 percent in Q3 2021. Rental vacancy has increased since the end of 2021, but has more recently exceeded pre-COVID levels to reach a high of 10 percent in Q1 2023.
Throughout the region, there are 4,505 federally-assisted rental units located across 52 properties. The bulk of assisted rental units (1,569) are supported by Low-Income Housing Tax Credits (LIHTC), while 1,507 receive Section 8 project-based rental assistance. It is important to note that multiple subsidy sources are often layered to provide greater funding leverage to support low-income households.
3.8 Affordability
Housing affordability is most often defined by housing where a homeowner or tenant is spending no more than 30 percent of their income on their housing costs. Those households that spend more than 30 percent are considered housing cost-burdened. This metric is a standard measurement for housing affordability, especially in terms of state and federal programs.
In the region, there was a total of 23,419 cost-burdened households in 2021, fifty-three percent of which were renters. This 2021 estimates is a 12 percent decrease from 2010 (-3,123), when the total cost-burdened households was 26,542. At that time, 59 percent of those cost-burdened households were homeowners, indicating a major shift in who is cost-burdened in the region.
The U.S. Department of Housing and Urban Development receives custom tabulations of American Community Survey data from the U.S. Census Bureau. This data is used to demonstrate the breadth of housing needs across the country. This data lags behind ACS data by about two years, but it provides a snapshot of the different impacts of cost burden by area median income, household type, and race and ethnicity.
From 2012 to 2020, cost burden in the region has generally been declining for higher income households, particularly those making above 50 percent AMI. But for households making 30 percent AMI or less, cost burden has increased rapidly between 2017 and 2018, going from 67 percent to 79 percent. Although there was an overall decline in cost-burdened households making 30 percent AMI or less between these years, the share grew significantly.
Across all household types, cost burden has been declining from 2012 to 2020. However, nearly a third of elderly, non-family (30 percent) and non-elderly, non-family (33 percent) household types are cost-burdened. These households are typically individuals living alone or with other unrelated adults. Family households are less likely to be cost-burdened, but nearly one in five large and small family households were still cost-burdened in 2020.
There has been a decline in the share of cost-burdened white, multiracial, and Asian households in the region between 2012 and 2020, while cost burden among Black households has seen the least amount of change. Although Hispanics were seeing increasing cost burden early in the decade, there has seemingly been a shift towards decreasing cost burden more recently.
Disparities exist and have persisted in regards to race and ethnicity and cost burden. White households are less likely to be cost-burdened than any other racial or ethnic group in the region. As of 2020, 18 percent of white households were cost-burdened. The closest group were Asian households and yet they were still eight percentage points above their white counterparts. Black and Hispanic experienced cost burden at least 15 percentage points above white households.